> ## Documentation Index
> Fetch the complete documentation index at: https://docs.twenty.com/llms.txt
> Use this file to discover all available pages before exploring further.

# Widgets

> Erkunden Sie die Widget-Typen und Visualisierungsoptionen in Twenty.

export const ChartIcon = ({icon, size = 20}) => {
  const icons = {
    'database': <svg xmlns="http://www.w3.org/2000/svg" width={size} height={size} viewBox="0 0 24 24" fill="none" stroke="currentColor" strokeWidth="2" strokeLinecap="round" strokeLinejoin="round">
        <path stroke="none" d="M0 0h24v24H0z" fill="none" />
        <path d="M4 6a8 3 0 1 0 16 0a8 3 0 1 0 -16 0" />
        <path d="M4 6v6a8 3 0 0 0 16 0v-6" />
        <path d="M4 12v6a8 3 0 0 0 16 0v-6" />
      </svg>,
    'filter': <svg xmlns="http://www.w3.org/2000/svg" width={size} height={size} viewBox="0 0 24 24" fill="none" stroke="currentColor" strokeWidth="2" strokeLinecap="round" strokeLinejoin="round">
        <path stroke="none" d="M0 0h24v24H0z" fill="none" />
        <path d="M4 4h16v2.172a2 2 0 0 1 -.586 1.414l-4.414 4.414v7l-6 2v-8.5l-4.48 -4.928a2 2 0 0 1 -.52 -1.345v-2.227" />
      </svg>,
    'axis-x': <svg xmlns="http://www.w3.org/2000/svg" width={size} height={size} viewBox="0 0 24 24" fill="none" stroke="currentColor" strokeWidth="2" strokeLinecap="round" strokeLinejoin="round">
        <path stroke="none" d="M0 0h24v24H0z" fill="none" />
        <path d="M4 13v.01" />
        <path d="M4 9v.01" />
        <path d="M4 5v.01" />
        <path d="M17 20l3 -3l-3 -3" />
        <path d="M4 17h16" />
      </svg>,
    'axis-y': <svg xmlns="http://www.w3.org/2000/svg" width={size} height={size} viewBox="0 0 24 24" fill="none" stroke="currentColor" strokeWidth="2" strokeLinecap="round" strokeLinejoin="round">
        <path stroke="none" d="M0 0h24v24H0z" fill="none" />
        <path d="M11 20h-.01" />
        <path d="M15 20h-.01" />
        <path d="M19 20h-.01" />
        <path d="M4 7l3 -3l3 3" />
        <path d="M7 20v-16" />
      </svg>,
    'sum': <svg xmlns="http://www.w3.org/2000/svg" width={size} height={size} viewBox="0 0 24 24" fill="none" stroke="currentColor" strokeWidth="2" strokeLinecap="round" strokeLinejoin="round">
        <path stroke="none" d="M0 0h24v24H0z" fill="none" />
        <path d="M18 16v2a1 1 0 0 1 -1 1h-11l6 -7l-6 -7h11a1 1 0 0 1 1 1v2" />
      </svg>,
    'chart-pie': <svg xmlns="http://www.w3.org/2000/svg" width={size} height={size} viewBox="0 0 24 24" fill="none" stroke="currentColor" strokeWidth="2" strokeLinecap="round" strokeLinejoin="round">
        <path stroke="none" d="M0 0h24v24H0z" fill="none" />
        <path d="M10 3.2a9 9 0 1 0 10.8 10.8a1 1 0 0 0 -1 -1h-6.8a2 2 0 0 1 -2 -2v-7a.9 .9 0 0 0 -1 -.8" />
        <path d="M15 3.5a9 9 0 0 1 5.5 5.5h-4.5a1 1 0 0 1 -1 -1v-4.5" />
      </svg>,
    'chart-line': <svg xmlns="http://www.w3.org/2000/svg" width={size} height={size} viewBox="0 0 24 24" fill="none" stroke="currentColor" strokeWidth="2" strokeLinecap="round" strokeLinejoin="round">
        <path stroke="none" d="M0 0h24v24H0z" fill="none" />
        <path d="M4 19l16 0" />
        <path d="M4 15l4 -6l4 2l4 -5l4 4" />
      </svg>,
    'calendar': <svg xmlns="http://www.w3.org/2000/svg" width={size} height={size} viewBox="0 0 24 24" fill="none" stroke="currentColor" strokeWidth="2" strokeLinecap="round" strokeLinejoin="round">
        <path stroke="none" d="M0 0h24v24H0z" fill="none" />
        <path d="M4 7a2 2 0 0 1 2 -2h12a2 2 0 0 1 2 2v12a2 2 0 0 1 -2 2h-12a2 2 0 0 1 -2 -2v-12" />
        <path d="M16 3v4" />
        <path d="M8 3v4" />
        <path d="M4 11h16" />
        <path d="M11 15h1" />
        <path d="M12 15v3" />
      </svg>,
    'arrows-sort': <svg xmlns="http://www.w3.org/2000/svg" width={size} height={size} viewBox="0 0 24 24" fill="none" stroke="currentColor" strokeWidth="2" strokeLinecap="round" strokeLinejoin="round">
        <path stroke="none" d="M0 0h24v24H0z" fill="none" />
        <path d="M3 9l4 -4l4 4m-4 -4v14" />
        <path d="M21 15l-4 4l-4 -4m4 4v-14" />
      </svg>,
    'filters': <svg xmlns="http://www.w3.org/2000/svg" width={size} height={size} viewBox="0 0 24 24" fill="none" stroke="currentColor" strokeWidth="2" strokeLinecap="round" strokeLinejoin="round">
        <path stroke="none" d="M0 0h24v24H0z" fill="none" />
        <path d="M7 8a5 5 0 1 0 10 0a5 5 0 1 0 -10 0" />
        <path d="M8 11a5 5 0 1 0 3.998 1.997" />
        <path d="M12.002 19.003a5 5 0 1 0 3.998 -8.003" />
      </svg>,
    'chart-bar-popular': <svg xmlns="http://www.w3.org/2000/svg" width={size} height={size} viewBox="0 0 24 24" fill="none" stroke="currentColor" strokeWidth="2" strokeLinecap="round" strokeLinejoin="round">
        <path stroke="none" d="M0 0h24v24H0z" fill="none" />
        <path d="M3 13a1 1 0 0 1 1 -1h4a1 1 0 0 1 1 1v6a1 1 0 0 1 -1 1h-4a1 1 0 0 1 -1 -1l0 -6" />
        <path d="M9 9a1 1 0 0 1 1 -1h4a1 1 0 0 1 1 1v10a1 1 0 0 1 -1 1h-4a1 1 0 0 1 -1 -1l0 -10" />
        <path d="M15 5a1 1 0 0 1 1 -1h4a1 1 0 0 1 1 1v14a1 1 0 0 1 -1 1h-4a1 1 0 0 1 -1 -1l0 -14" />
        <path d="M4 20h14" />
      </svg>,
    'math-min': <svg xmlns="http://www.w3.org/2000/svg" width={size} height={size} viewBox="0 0 24 24" fill="none" stroke="currentColor" strokeWidth="2" strokeLinecap="round" strokeLinejoin="round">
        <path stroke="none" d="M0 0h24v24H0z" fill="none" />
        <path d="M15 18a2 2 0 1 0 4 0a2 2 0 0 0 -4 0" />
        <path d="M3 13s1 -9 4 -9c2.48 0 5.643 9.565 8.36 12.883" />
        <path d="M18.748 17.038c.702 -.88 1.452 -3.56 2.252 -8.038" />
      </svg>,
    'math-max': <svg xmlns="http://www.w3.org/2000/svg" width={size} height={size} viewBox="0 0 24 24" fill="none" stroke="currentColor" strokeWidth="2" strokeLinecap="round" strokeLinejoin="round">
        <path stroke="none" d="M0 0h24v24H0z" fill="none" />
        <path d="M5 6a2 2 0 1 0 4 0a2 2 0 0 0 -4 0" />
        <path d="M3 15s.616 -5.544 2.332 -7.93" />
        <path d="M8.637 7.112c2.717 3.313 5.882 12.888 8.363 12.888c2 0 3.333 -3 4 -9" />
      </svg>,
    'color-swatch': <svg xmlns="http://www.w3.org/2000/svg" width={size} height={size} viewBox="0 0 24 24" fill="none" stroke="currentColor" strokeWidth="2" strokeLinecap="round" strokeLinejoin="round">
        <path stroke="none" d="M0 0h24v24H0z" fill="none" />
        <path d="M19 3h-4a2 2 0 0 0 -2 2v12a4 4 0 0 0 8 0v-12a2 2 0 0 0 -2 -2" />
        <path d="M13 7.35l-2 -2a2 2 0 0 0 -2.828 0l-2.828 2.828a2 2 0 0 0 0 2.828l9 9" />
        <path d="M7.3 13h-2.3a2 2 0 0 0 -2 2v4a2 2 0 0 0 2 2h12" />
        <path d="M17 17l0 .01" />
      </svg>,
    'gizmo': <svg xmlns="http://www.w3.org/2000/svg" width={size} height={size} viewBox="0 0 24 24" fill="none" stroke="currentColor" strokeWidth="2" strokeLinecap="round" strokeLinejoin="round">
        <path stroke="none" d="M0 0h24v24H0z" fill="none" />
        <path d="M20 19l-8 -5.5l-8 5.5" />
        <path d="M12 4v9.5" />
        <path d="M11 4a1 1 0 1 0 2 0a1 1 0 1 0 -2 0" />
        <path d="M3 19a1 1 0 1 0 2 0a1 1 0 1 0 -2 0" />
        <path d="M19 19a1 1 0 1 0 2 0a1 1 0 1 0 -2 0" />
      </svg>,
    'stack-2': <svg xmlns="http://www.w3.org/2000/svg" width={size} height={size} viewBox="0 0 24 24" fill="none" stroke="currentColor" strokeWidth="2" strokeLinecap="round" strokeLinejoin="round">
        <path stroke="none" d="M0 0h24v24H0z" fill="none" />
        <path d="M12 4l-8 4l8 4l8 -4l-8 -4" />
        <path d="M4 12l8 4l8 -4" />
        <path d="M4 16l8 4l8 -4" />
      </svg>,
    'badge-2k': <svg xmlns="http://www.w3.org/2000/svg" width={size} height={size} viewBox="0 0 24 24" fill="none" stroke="currentColor" strokeWidth="2" strokeLinecap="round" strokeLinejoin="round">
        <path stroke="none" d="M0 0h24v24H0z" fill="none" />
        <path d="M3 7a2 2 0 0 1 2 -2h14a2 2 0 0 1 2 2v10a2 2 0 0 1 -2 2h-14a2 2 0 0 1 -2 -2l0 -10" />
        <path d="M14 9v6" />
        <path d="M17 9l-2 3l2 3" />
        <path d="M15 12h-1" />
        <path d="M7 9h2a1 1 0 0 1 1 1v1a1 1 0 0 1 -1 1h-1a1 1 0 0 0 -1 1v1a1 1 0 0 0 1 1h2" />
      </svg>,
    'text-caption': <svg xmlns="http://www.w3.org/2000/svg" width={size} height={size} viewBox="0 0 24 24" fill="none" stroke="currentColor" strokeWidth="2" strokeLinecap="round" strokeLinejoin="round">
        <path stroke="none" d="M0 0h24v24H0z" fill="none" />
        <path d="M4 15h16" />
        <path d="M4 5a1 1 0 0 1 1 -1h4a1 1 0 0 1 1 1v4a1 1 0 0 1 -1 1h-4a1 1 0 0 1 -1 -1l0 -4" />
        <path d="M4 20h12" />
      </svg>,
    'eye-off': <svg xmlns="http://www.w3.org/2000/svg" width={size} height={size} viewBox="0 0 24 24" fill="none" stroke="currentColor" strokeWidth="2" strokeLinecap="round" strokeLinejoin="round">
        <path stroke="none" d="M0 0h24v24H0z" fill="none" />
        <path d="M10.585 10.587a2 2 0 0 0 2.829 2.828" />
        <path d="M16.681 16.673a8.717 8.717 0 0 1 -4.681 1.327c-3.6 0 -6.6 -2 -9 -6c1.272 -2.12 2.712 -3.678 4.32 -4.674m2.86 -1.146a9.055 9.055 0 0 1 1.82 -.18c3.6 0 6.6 2 9 6c-.666 1.11 -1.379 2.067 -2.138 2.87" />
        <path d="M3 3l18 18" />
      </svg>,
    'caret-left': <svg xmlns="http://www.w3.org/2000/svg" width={size} height={size} viewBox="0 0 24 24" fill="none" stroke="currentColor" strokeWidth="2" strokeLinecap="round" strokeLinejoin="round">
        <path stroke="none" d="M0 0h24v24H0z" fill="none" />
        <path d="M14 6l-6 6l6 6v-12" />
      </svg>,
    'caret-right': <svg xmlns="http://www.w3.org/2000/svg" width={size} height={size} viewBox="0 0 24 24" fill="none" stroke="currentColor" strokeWidth="2" strokeLinecap="round" strokeLinejoin="round">
        <path stroke="none" d="M0 0h24v24H0z" fill="none" />
        <path d="M10 18l6 -6l-6 -6v12" />
      </svg>,
    'number-123': <svg xmlns="http://www.w3.org/2000/svg" width={size} height={size} viewBox="0 0 24 24" fill="none" stroke="currentColor" strokeWidth="2" strokeLinecap="round" strokeLinejoin="round">
        <path stroke="none" d="M0 0h24v24H0z" fill="none" />
        <path d="M3 10l2 -2v8" />
        <path d="M9 8h3a1 1 0 0 1 1 1v2a1 1 0 0 1 -1 1h-2a1 1 0 0 0 -1 1v2a1 1 0 0 0 1 1h3" />
        <path d="M17 8h2.5a1.5 1.5 0 0 1 1.5 1.5v1a1.5 1.5 0 0 1 -1.5 1.5h-1.5h1.5a1.5 1.5 0 0 1 1.5 1.5v1a1.5 1.5 0 0 1 -1.5 1.5h-2.5" />
      </svg>,
    'frame': <svg xmlns="http://www.w3.org/2000/svg" width={size} height={size} viewBox="0 0 24 24" fill="none" stroke="currentColor" strokeWidth="2" strokeLinecap="round" strokeLinejoin="round">
        <path stroke="none" d="M0 0h24v24H0z" fill="none" />
        <path d="M4 7l16 0" />
        <path d="M4 17l16 0" />
        <path d="M7 4l0 16" />
        <path d="M17 4l0 16" />
      </svg>,
    'align-box-left-top': <svg xmlns="http://www.w3.org/2000/svg" width={size} height={size} viewBox="0 0 24 24" fill="none" stroke="currentColor" strokeWidth="2" strokeLinecap="round" strokeLinejoin="round">
        <path stroke="none" d="M0 0h24v24H0z" fill="none" />
        <path d="M3 5a2 2 0 0 1 2 -2h14a2 2 0 0 1 2 2v14a2 2 0 0 1 -2 2h-14a2 2 0 0 1 -2 -2v-14" />
        <path d="M9 13h-2" />
        <path d="M13 10h-6" />
        <path d="M11 7h-4" />
      </svg>
  };
  const selectedIcon = icons[icon];
  if (!selectedIcon) {
    return null;
  }
  return selectedIcon;
};

## Verfügbare Widgets

Twenty bietet verschiedene Widget-Typen, um Ihre CRM-Daten zu visualisieren.

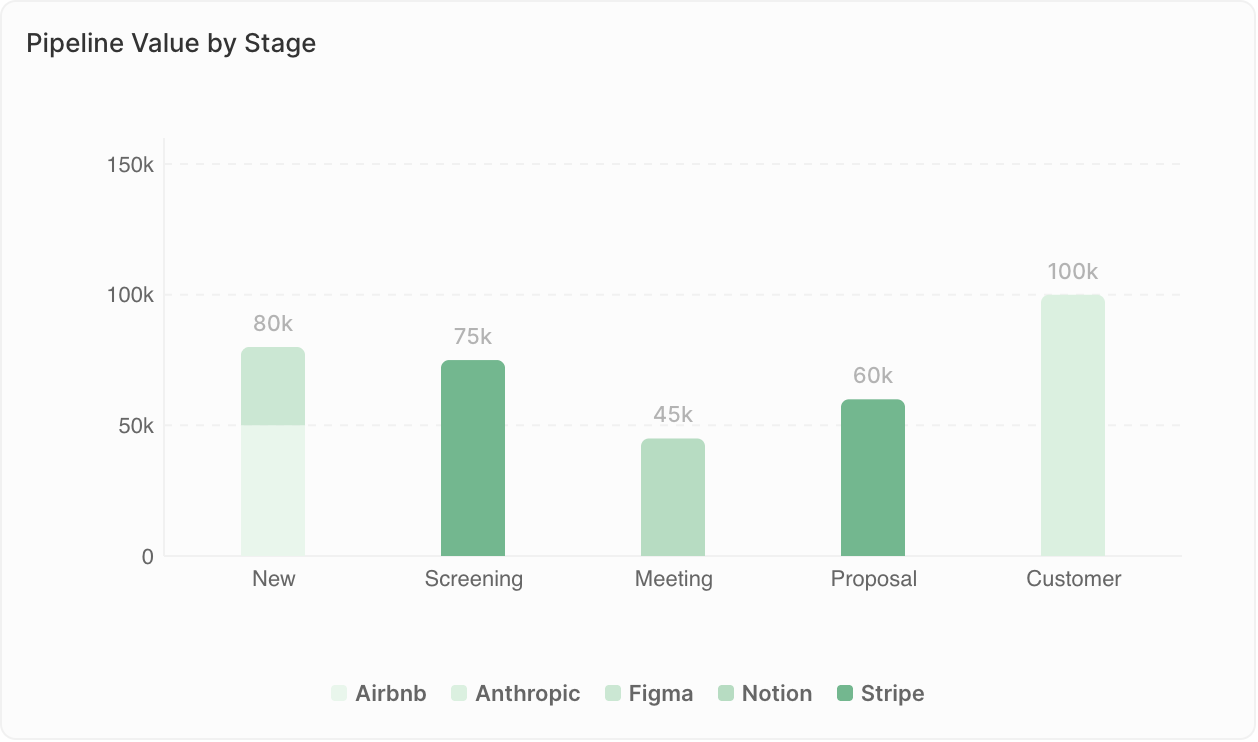
### <span style={{ display: 'inline-flex', alignItems: 'center', gap: '8px' }}><ChartIcon icon="chart-bar-popular" />Balkendiagramme</span>

Stellen Sie Daten als horizontale oder vertikale Balken dar.

<Frame>
  <img src="https://mintcdn.com/twenty/rtjyQTAh0DrLn5Sz/images/user-guide/dashboard/dashboard-widget-bar-chart.png?fit=max&auto=format&n=rtjyQTAh0DrLn5Sz&q=85&s=81765220d7d28faa18aedffa5e669174" alt="Balkendiagramm" width="1258" height="742" data-path="images/user-guide/dashboard/dashboard-widget-bar-chart.png" />
</Frame>

**Am besten geeignet für:**

* Vergleich von Werten über Kategorien hinweg
* Ranglisten anzeigen
* Kennzahlen nach Zeitraum verfolgen

**Beispielverwendung:**

* Deals nach Phase
* Umsatz nach Vertriebsmitarbeitern
* Hinzugefügte Kontakte pro Monat

<Note>
  **Anzeigegrenzen**: Balkendiagramme können maximal 100 Balken anzeigen sowie bei Verwendung von Group By 50 Gruppen pro Balken. Wenn Sie die Warnung "Nicht angezeigte Daten: max. X Balken pro Diagramm" sehen, fügen Sie Filter hinzu, um Ihre Daten einzugrenzen, oder ändern Sie die Gruppierung (z. B. nach Woche statt nach Tagen).
</Note>

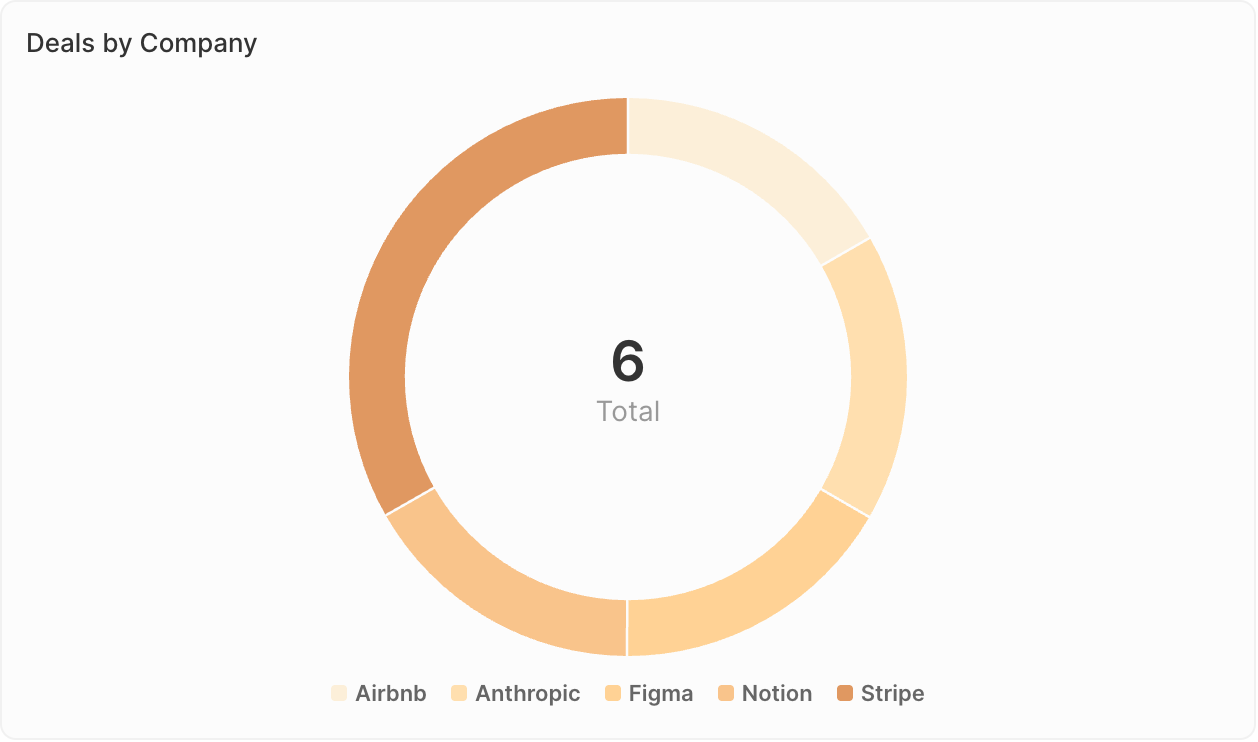
### <span style={{ display: 'inline-flex', alignItems: 'center', gap: '8px' }}><ChartIcon icon="chart-pie" />Tortendiagramme</span>

Zeigen Sie Anteile eines Ganzen.

<Frame>
  <img src="https://mintcdn.com/twenty/rtjyQTAh0DrLn5Sz/images/user-guide/dashboard/dashboard-widget-pie-chart.png?fit=max&auto=format&n=rtjyQTAh0DrLn5Sz&q=85&s=b3172f5c7a5f1f40a6e5e463f0172446" alt="Tortendiagramm" width="1258" height="742" data-path="images/user-guide/dashboard/dashboard-widget-pie-chart.png" />
</Frame>

**Am besten geeignet für:**

* Zusammensetzung oder Verteilung anzeigen
* Teile mit dem Ganzen vergleichen
* Wichtige Segmente hervorheben

**Beispielverwendung:**

* Deal-Verteilung nach Quelle
* Kontaktaufschlüsselung nach Branche
* Pipeline-Zusammensetzung nach Eigentümer

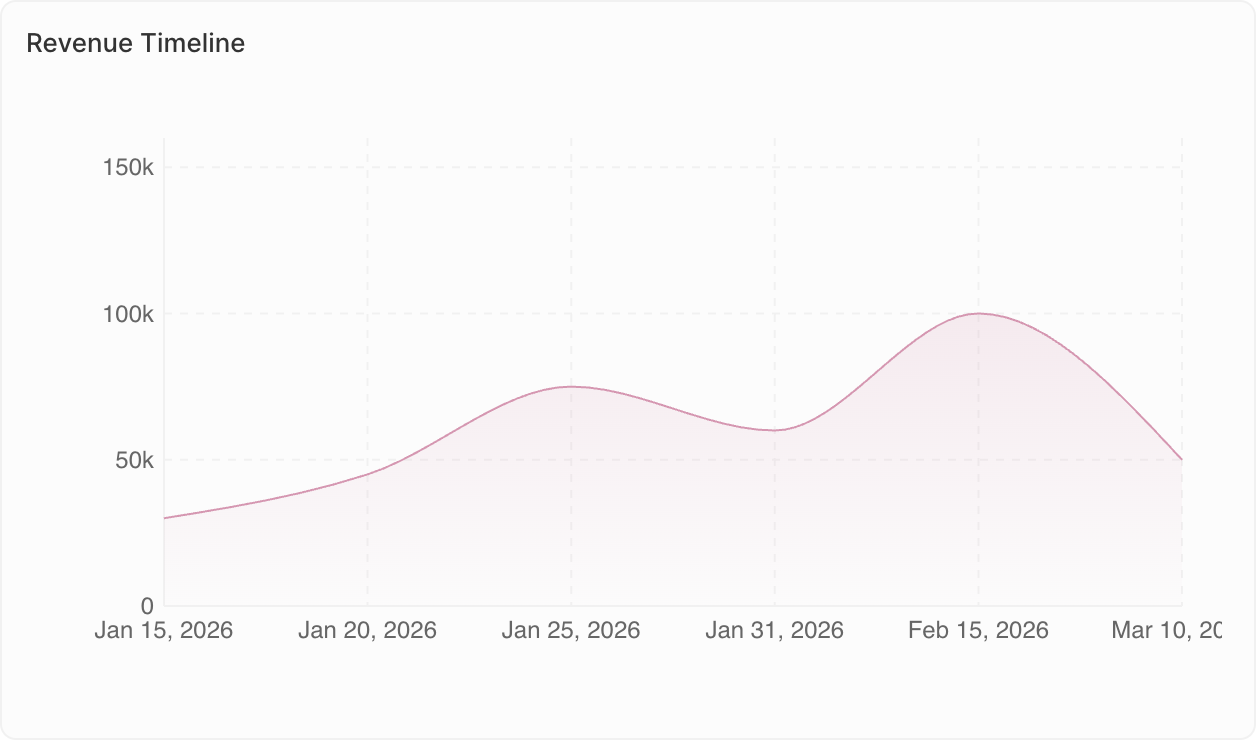
### <span style={{ display: 'inline-flex', alignItems: 'center', gap: '8px' }}><ChartIcon icon="chart-line" />Liniendiagramme</span>

Stellen Sie Trends im Zeitverlauf dar.

<Frame>
  <img src="https://mintcdn.com/twenty/rtjyQTAh0DrLn5Sz/images/user-guide/dashboard/dashboard-widget-line-chart.png?fit=max&auto=format&n=rtjyQTAh0DrLn5Sz&q=85&s=6ec6177e1f779cac4dfb4c42fc4de0fc" alt="Liniendiagramm" width="1258" height="742" data-path="images/user-guide/dashboard/dashboard-widget-line-chart.png" />
</Frame>

**Am besten geeignet für:**

* Veränderungen im Zeitverlauf verfolgen
* Trends erkennen
* Mehrere Kennzahlen vergleichen

**Beispielverwendung:**

* Monatlicher Trend der Anzahl der Deals
* Umsatzwachstum über Quartale
* Aktivitätsniveau im Zeitverlauf

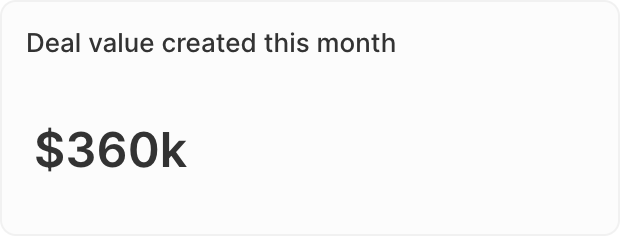
### <span style={{ display: 'inline-flex', alignItems: 'center', gap: '8px' }}><ChartIcon icon="sum" />Aggregierte Diagramme</span>

Zeigen Sie einzelne Kennzahlen prominent an.

<Frame>
  <img src="https://mintcdn.com/twenty/rtjyQTAh0DrLn5Sz/images/user-guide/dashboard/dashboard-widget-aggregate-chart.png?fit=max&auto=format&n=rtjyQTAh0DrLn5Sz&q=85&s=ce43dedfdcfc4512b7c616c7a78df75a" alt="Aggregiertes Diagramm" width="622" height="236" data-path="images/user-guide/dashboard/dashboard-widget-aggregate-chart.png" />
</Frame>

**Am besten geeignet für:**

* KPIs hervorheben
* Summen oder Durchschnitte anzeigen
* Schnelle Statusprüfungen

**Beispielverwendung:**

* Gesamtwert der Pipeline
* Anzahl offener Chancen
* Konversionsrate

**Erweiterte Optionen:**

* **Verhältnis**: Berechnen Sie für Select-Felder Verhältnisse zwischen Werten. Gehen Sie zu **Angezeigte Daten** → wählen Sie Ihr Feld → aktivieren Sie die Option **Verhältnis**.
* **Präfix & Suffix**: Fügen Sie benutzerdefinierten Text vor oder nach der Zahl hinzu (z. B. "\$"-Präfix oder "%"-Suffix) für eine bessere Lesbarkeit.

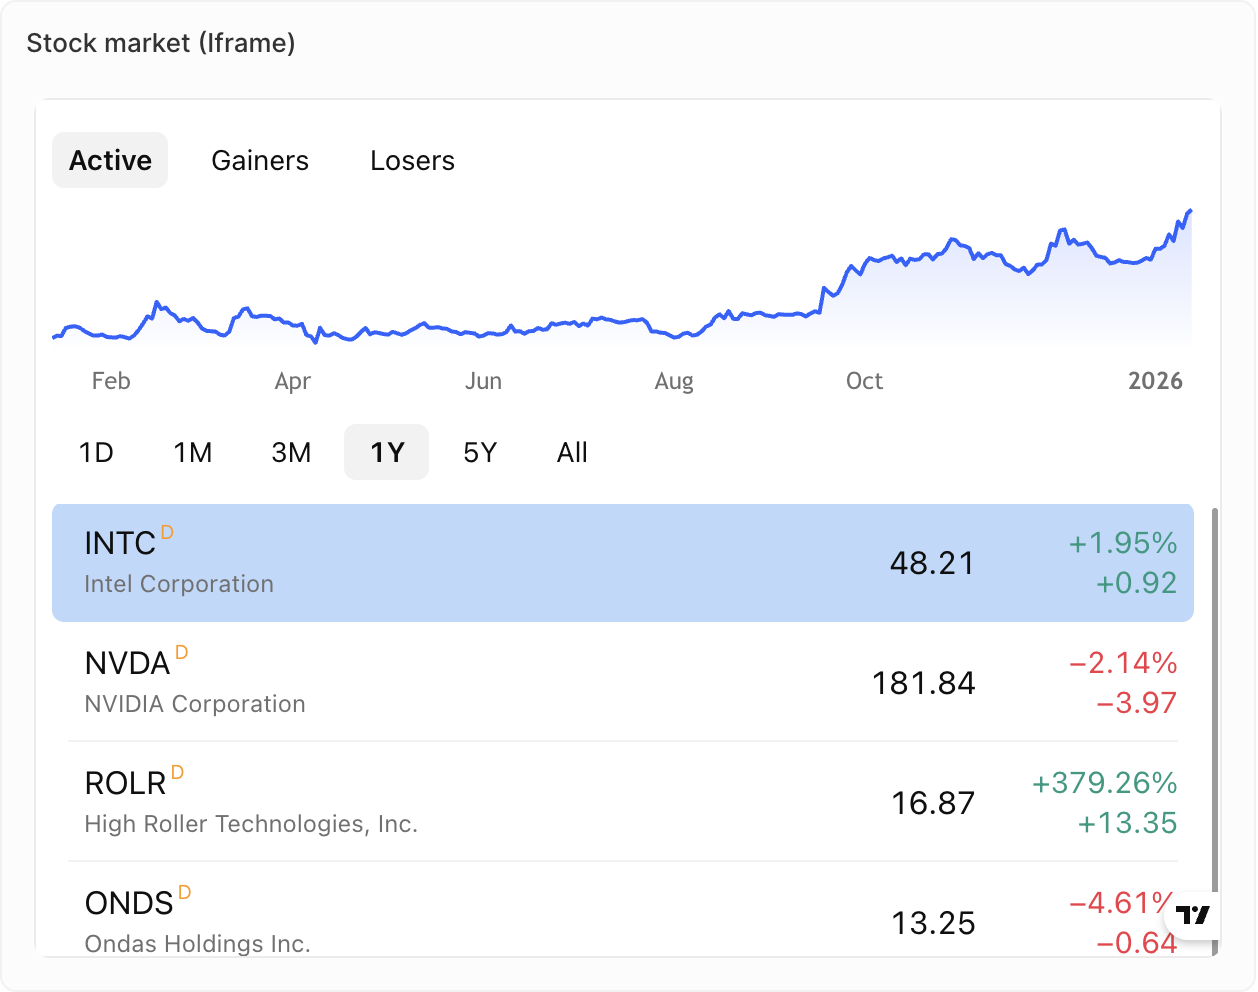
### <span style={{ display: 'inline-flex', alignItems: 'center', gap: '8px' }}><ChartIcon icon="frame" />iFrames</span>

Betten Sie externe Tools und Inhalte direkt in Ihr Dashboard ein.

<Frame>
  <img src="https://mintcdn.com/twenty/rtjyQTAh0DrLn5Sz/images/user-guide/dashboard/dashboard-widget-iframe.png?fit=max&auto=format&n=rtjyQTAh0DrLn5Sz&q=85&s=52cba90e5d56ce805c1d6cdd17c8f2a8" alt="iFrame" width="1258" height="992" data-path="images/user-guide/dashboard/dashboard-widget-iframe.png" />
</Frame>

**Am besten geeignet für:**

* Externe Berichte oder Dashboards anzeigen
* Vertriebstools von Drittanbietern integrieren
* Live-Inhalte aus anderen Systemen anzeigen

**Beispielverwendung:**

* Kennzahlen aus Ihrem Support-Tool
* Kennzahlen aus Ihrem Dialer
* Live-Inhalte aus Ihrem Tool für Sales-Sequenzen

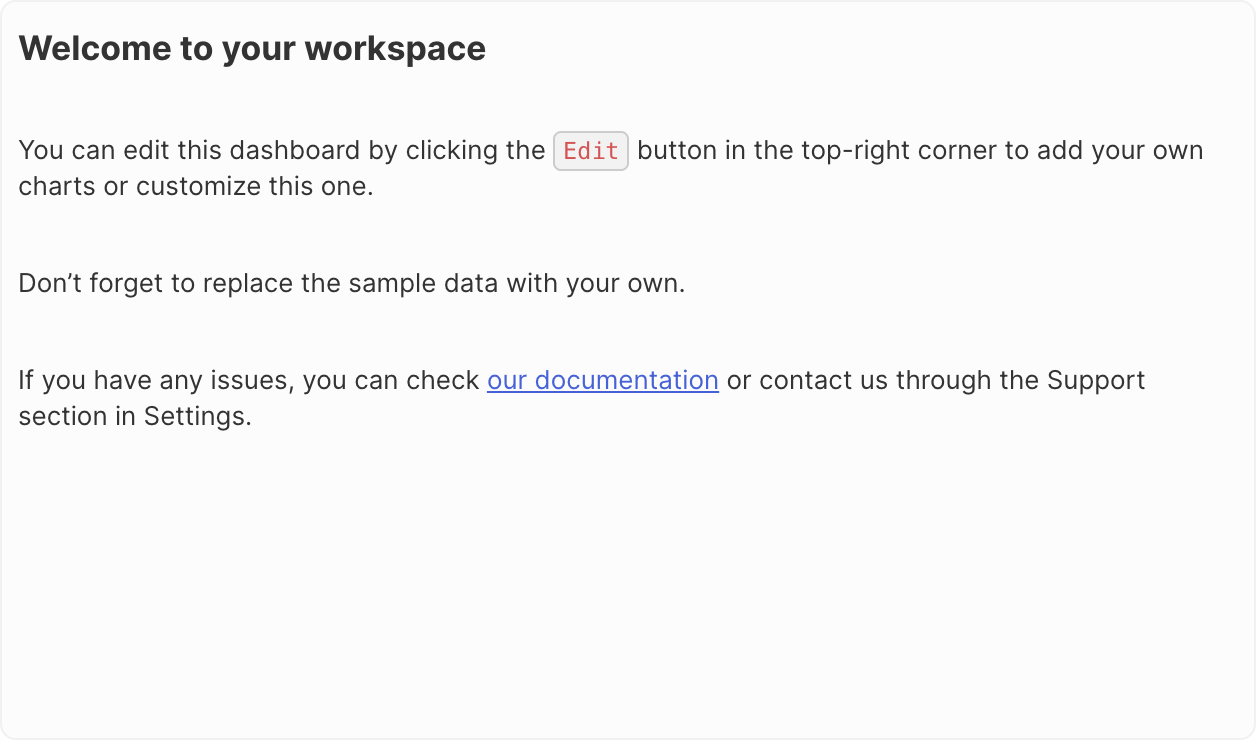
### <span style={{ display: 'inline-flex', alignItems: 'center', gap: '8px' }}><ChartIcon icon="align-box-left-top" />Rich-Text</span>

Fügen Sie formatierten Text und Inhalte direkt zu Ihrem Dashboard hinzu.

<Frame>
  <img src="https://mintcdn.com/twenty/rtjyQTAh0DrLn5Sz/images/user-guide/dashboard/dashboard-widget-rich-text.png?fit=max&auto=format&n=rtjyQTAh0DrLn5Sz&q=85&s=e006d6b5fe8c362b66a43b1a03096a5a" alt="Rich-Text" width="1258" height="742" data-path="images/user-guide/dashboard/dashboard-widget-rich-text.png" />
</Frame>

**Am besten geeignet für:**

* Kontext oder Anweisungen hinzufügen
* Dashboard-Beschreibungen
* Notizen und Anmerkungen

**Funktionen:**

* Rich-Text-Formatierung (fett, kursiv, Listen usw.)
* Bild- und Dateiuploads
* Bearbeitung im Markdown-Stil

<Note>
  **Bald verfügbar**: Tachometerdiagramme und Tabellen sind noch nicht verfügbar, stehen aber auf unserer Roadmap.
</Note>

### Widgets duplizieren

1. Klicken Sie auf das Widget
2. Öffnen Sie **Optionen**
3. Klicken Sie auf **Widget duplizieren**