> ## Documentation Index
> Fetch the complete documentation index at: https://docs.twenty.com/llms.txt
> Use this file to discover all available pages before exploring further.

# 차트 설정

> 필요에 맞게 데이터를 정확히 표시하도록 차트를 구성하세요.

export const ChartIcon = ({icon, size = 20}) => {
  const icons = {
    'database': <svg xmlns="http://www.w3.org/2000/svg" width={size} height={size} viewBox="0 0 24 24" fill="none" stroke="currentColor" strokeWidth="2" strokeLinecap="round" strokeLinejoin="round">
        <path stroke="none" d="M0 0h24v24H0z" fill="none" />
        <path d="M4 6a8 3 0 1 0 16 0a8 3 0 1 0 -16 0" />
        <path d="M4 6v6a8 3 0 0 0 16 0v-6" />
        <path d="M4 12v6a8 3 0 0 0 16 0v-6" />
      </svg>,
    'filter': <svg xmlns="http://www.w3.org/2000/svg" width={size} height={size} viewBox="0 0 24 24" fill="none" stroke="currentColor" strokeWidth="2" strokeLinecap="round" strokeLinejoin="round">
        <path stroke="none" d="M0 0h24v24H0z" fill="none" />
        <path d="M4 4h16v2.172a2 2 0 0 1 -.586 1.414l-4.414 4.414v7l-6 2v-8.5l-4.48 -4.928a2 2 0 0 1 -.52 -1.345v-2.227" />
      </svg>,
    'axis-x': <svg xmlns="http://www.w3.org/2000/svg" width={size} height={size} viewBox="0 0 24 24" fill="none" stroke="currentColor" strokeWidth="2" strokeLinecap="round" strokeLinejoin="round">
        <path stroke="none" d="M0 0h24v24H0z" fill="none" />
        <path d="M4 13v.01" />
        <path d="M4 9v.01" />
        <path d="M4 5v.01" />
        <path d="M17 20l3 -3l-3 -3" />
        <path d="M4 17h16" />
      </svg>,
    'axis-y': <svg xmlns="http://www.w3.org/2000/svg" width={size} height={size} viewBox="0 0 24 24" fill="none" stroke="currentColor" strokeWidth="2" strokeLinecap="round" strokeLinejoin="round">
        <path stroke="none" d="M0 0h24v24H0z" fill="none" />
        <path d="M11 20h-.01" />
        <path d="M15 20h-.01" />
        <path d="M19 20h-.01" />
        <path d="M4 7l3 -3l3 3" />
        <path d="M7 20v-16" />
      </svg>,
    'sum': <svg xmlns="http://www.w3.org/2000/svg" width={size} height={size} viewBox="0 0 24 24" fill="none" stroke="currentColor" strokeWidth="2" strokeLinecap="round" strokeLinejoin="round">
        <path stroke="none" d="M0 0h24v24H0z" fill="none" />
        <path d="M18 16v2a1 1 0 0 1 -1 1h-11l6 -7l-6 -7h11a1 1 0 0 1 1 1v2" />
      </svg>,
    'chart-pie': <svg xmlns="http://www.w3.org/2000/svg" width={size} height={size} viewBox="0 0 24 24" fill="none" stroke="currentColor" strokeWidth="2" strokeLinecap="round" strokeLinejoin="round">
        <path stroke="none" d="M0 0h24v24H0z" fill="none" />
        <path d="M10 3.2a9 9 0 1 0 10.8 10.8a1 1 0 0 0 -1 -1h-6.8a2 2 0 0 1 -2 -2v-7a.9 .9 0 0 0 -1 -.8" />
        <path d="M15 3.5a9 9 0 0 1 5.5 5.5h-4.5a1 1 0 0 1 -1 -1v-4.5" />
      </svg>,
    'chart-line': <svg xmlns="http://www.w3.org/2000/svg" width={size} height={size} viewBox="0 0 24 24" fill="none" stroke="currentColor" strokeWidth="2" strokeLinecap="round" strokeLinejoin="round">
        <path stroke="none" d="M0 0h24v24H0z" fill="none" />
        <path d="M4 19l16 0" />
        <path d="M4 15l4 -6l4 2l4 -5l4 4" />
      </svg>,
    'calendar': <svg xmlns="http://www.w3.org/2000/svg" width={size} height={size} viewBox="0 0 24 24" fill="none" stroke="currentColor" strokeWidth="2" strokeLinecap="round" strokeLinejoin="round">
        <path stroke="none" d="M0 0h24v24H0z" fill="none" />
        <path d="M4 7a2 2 0 0 1 2 -2h12a2 2 0 0 1 2 2v12a2 2 0 0 1 -2 2h-12a2 2 0 0 1 -2 -2v-12" />
        <path d="M16 3v4" />
        <path d="M8 3v4" />
        <path d="M4 11h16" />
        <path d="M11 15h1" />
        <path d="M12 15v3" />
      </svg>,
    'arrows-sort': <svg xmlns="http://www.w3.org/2000/svg" width={size} height={size} viewBox="0 0 24 24" fill="none" stroke="currentColor" strokeWidth="2" strokeLinecap="round" strokeLinejoin="round">
        <path stroke="none" d="M0 0h24v24H0z" fill="none" />
        <path d="M3 9l4 -4l4 4m-4 -4v14" />
        <path d="M21 15l-4 4l-4 -4m4 4v-14" />
      </svg>,
    'filters': <svg xmlns="http://www.w3.org/2000/svg" width={size} height={size} viewBox="0 0 24 24" fill="none" stroke="currentColor" strokeWidth="2" strokeLinecap="round" strokeLinejoin="round">
        <path stroke="none" d="M0 0h24v24H0z" fill="none" />
        <path d="M7 8a5 5 0 1 0 10 0a5 5 0 1 0 -10 0" />
        <path d="M8 11a5 5 0 1 0 3.998 1.997" />
        <path d="M12.002 19.003a5 5 0 1 0 3.998 -8.003" />
      </svg>,
    'chart-bar-popular': <svg xmlns="http://www.w3.org/2000/svg" width={size} height={size} viewBox="0 0 24 24" fill="none" stroke="currentColor" strokeWidth="2" strokeLinecap="round" strokeLinejoin="round">
        <path stroke="none" d="M0 0h24v24H0z" fill="none" />
        <path d="M3 13a1 1 0 0 1 1 -1h4a1 1 0 0 1 1 1v6a1 1 0 0 1 -1 1h-4a1 1 0 0 1 -1 -1l0 -6" />
        <path d="M9 9a1 1 0 0 1 1 -1h4a1 1 0 0 1 1 1v10a1 1 0 0 1 -1 1h-4a1 1 0 0 1 -1 -1l0 -10" />
        <path d="M15 5a1 1 0 0 1 1 -1h4a1 1 0 0 1 1 1v14a1 1 0 0 1 -1 1h-4a1 1 0 0 1 -1 -1l0 -14" />
        <path d="M4 20h14" />
      </svg>,
    'math-min': <svg xmlns="http://www.w3.org/2000/svg" width={size} height={size} viewBox="0 0 24 24" fill="none" stroke="currentColor" strokeWidth="2" strokeLinecap="round" strokeLinejoin="round">
        <path stroke="none" d="M0 0h24v24H0z" fill="none" />
        <path d="M15 18a2 2 0 1 0 4 0a2 2 0 0 0 -4 0" />
        <path d="M3 13s1 -9 4 -9c2.48 0 5.643 9.565 8.36 12.883" />
        <path d="M18.748 17.038c.702 -.88 1.452 -3.56 2.252 -8.038" />
      </svg>,
    'math-max': <svg xmlns="http://www.w3.org/2000/svg" width={size} height={size} viewBox="0 0 24 24" fill="none" stroke="currentColor" strokeWidth="2" strokeLinecap="round" strokeLinejoin="round">
        <path stroke="none" d="M0 0h24v24H0z" fill="none" />
        <path d="M5 6a2 2 0 1 0 4 0a2 2 0 0 0 -4 0" />
        <path d="M3 15s.616 -5.544 2.332 -7.93" />
        <path d="M8.637 7.112c2.717 3.313 5.882 12.888 8.363 12.888c2 0 3.333 -3 4 -9" />
      </svg>,
    'color-swatch': <svg xmlns="http://www.w3.org/2000/svg" width={size} height={size} viewBox="0 0 24 24" fill="none" stroke="currentColor" strokeWidth="2" strokeLinecap="round" strokeLinejoin="round">
        <path stroke="none" d="M0 0h24v24H0z" fill="none" />
        <path d="M19 3h-4a2 2 0 0 0 -2 2v12a4 4 0 0 0 8 0v-12a2 2 0 0 0 -2 -2" />
        <path d="M13 7.35l-2 -2a2 2 0 0 0 -2.828 0l-2.828 2.828a2 2 0 0 0 0 2.828l9 9" />
        <path d="M7.3 13h-2.3a2 2 0 0 0 -2 2v4a2 2 0 0 0 2 2h12" />
        <path d="M17 17l0 .01" />
      </svg>,
    'gizmo': <svg xmlns="http://www.w3.org/2000/svg" width={size} height={size} viewBox="0 0 24 24" fill="none" stroke="currentColor" strokeWidth="2" strokeLinecap="round" strokeLinejoin="round">
        <path stroke="none" d="M0 0h24v24H0z" fill="none" />
        <path d="M20 19l-8 -5.5l-8 5.5" />
        <path d="M12 4v9.5" />
        <path d="M11 4a1 1 0 1 0 2 0a1 1 0 1 0 -2 0" />
        <path d="M3 19a1 1 0 1 0 2 0a1 1 0 1 0 -2 0" />
        <path d="M19 19a1 1 0 1 0 2 0a1 1 0 1 0 -2 0" />
      </svg>,
    'stack-2': <svg xmlns="http://www.w3.org/2000/svg" width={size} height={size} viewBox="0 0 24 24" fill="none" stroke="currentColor" strokeWidth="2" strokeLinecap="round" strokeLinejoin="round">
        <path stroke="none" d="M0 0h24v24H0z" fill="none" />
        <path d="M12 4l-8 4l8 4l8 -4l-8 -4" />
        <path d="M4 12l8 4l8 -4" />
        <path d="M4 16l8 4l8 -4" />
      </svg>,
    'badge-2k': <svg xmlns="http://www.w3.org/2000/svg" width={size} height={size} viewBox="0 0 24 24" fill="none" stroke="currentColor" strokeWidth="2" strokeLinecap="round" strokeLinejoin="round">
        <path stroke="none" d="M0 0h24v24H0z" fill="none" />
        <path d="M3 7a2 2 0 0 1 2 -2h14a2 2 0 0 1 2 2v10a2 2 0 0 1 -2 2h-14a2 2 0 0 1 -2 -2l0 -10" />
        <path d="M14 9v6" />
        <path d="M17 9l-2 3l2 3" />
        <path d="M15 12h-1" />
        <path d="M7 9h2a1 1 0 0 1 1 1v1a1 1 0 0 1 -1 1h-1a1 1 0 0 0 -1 1v1a1 1 0 0 0 1 1h2" />
      </svg>,
    'text-caption': <svg xmlns="http://www.w3.org/2000/svg" width={size} height={size} viewBox="0 0 24 24" fill="none" stroke="currentColor" strokeWidth="2" strokeLinecap="round" strokeLinejoin="round">
        <path stroke="none" d="M0 0h24v24H0z" fill="none" />
        <path d="M4 15h16" />
        <path d="M4 5a1 1 0 0 1 1 -1h4a1 1 0 0 1 1 1v4a1 1 0 0 1 -1 1h-4a1 1 0 0 1 -1 -1l0 -4" />
        <path d="M4 20h12" />
      </svg>,
    'eye-off': <svg xmlns="http://www.w3.org/2000/svg" width={size} height={size} viewBox="0 0 24 24" fill="none" stroke="currentColor" strokeWidth="2" strokeLinecap="round" strokeLinejoin="round">
        <path stroke="none" d="M0 0h24v24H0z" fill="none" />
        <path d="M10.585 10.587a2 2 0 0 0 2.829 2.828" />
        <path d="M16.681 16.673a8.717 8.717 0 0 1 -4.681 1.327c-3.6 0 -6.6 -2 -9 -6c1.272 -2.12 2.712 -3.678 4.32 -4.674m2.86 -1.146a9.055 9.055 0 0 1 1.82 -.18c3.6 0 6.6 2 9 6c-.666 1.11 -1.379 2.067 -2.138 2.87" />
        <path d="M3 3l18 18" />
      </svg>,
    'caret-left': <svg xmlns="http://www.w3.org/2000/svg" width={size} height={size} viewBox="0 0 24 24" fill="none" stroke="currentColor" strokeWidth="2" strokeLinecap="round" strokeLinejoin="round">
        <path stroke="none" d="M0 0h24v24H0z" fill="none" />
        <path d="M14 6l-6 6l6 6v-12" />
      </svg>,
    'caret-right': <svg xmlns="http://www.w3.org/2000/svg" width={size} height={size} viewBox="0 0 24 24" fill="none" stroke="currentColor" strokeWidth="2" strokeLinecap="round" strokeLinejoin="round">
        <path stroke="none" d="M0 0h24v24H0z" fill="none" />
        <path d="M10 18l6 -6l-6 -6v12" />
      </svg>,
    'number-123': <svg xmlns="http://www.w3.org/2000/svg" width={size} height={size} viewBox="0 0 24 24" fill="none" stroke="currentColor" strokeWidth="2" strokeLinecap="round" strokeLinejoin="round">
        <path stroke="none" d="M0 0h24v24H0z" fill="none" />
        <path d="M3 10l2 -2v8" />
        <path d="M9 8h3a1 1 0 0 1 1 1v2a1 1 0 0 1 -1 1h-2a1 1 0 0 0 -1 1v2a1 1 0 0 0 1 1h3" />
        <path d="M17 8h2.5a1.5 1.5 0 0 1 1.5 1.5v1a1.5 1.5 0 0 1 -1.5 1.5h-1.5h1.5a1.5 1.5 0 0 1 1.5 1.5v1a1.5 1.5 0 0 1 -1.5 1.5h-2.5" />
      </svg>,
    'frame': <svg xmlns="http://www.w3.org/2000/svg" width={size} height={size} viewBox="0 0 24 24" fill="none" stroke="currentColor" strokeWidth="2" strokeLinecap="round" strokeLinejoin="round">
        <path stroke="none" d="M0 0h24v24H0z" fill="none" />
        <path d="M4 7l16 0" />
        <path d="M4 17l16 0" />
        <path d="M7 4l0 16" />
        <path d="M17 4l0 16" />
      </svg>,
    'align-box-left-top': <svg xmlns="http://www.w3.org/2000/svg" width={size} height={size} viewBox="0 0 24 24" fill="none" stroke="currentColor" strokeWidth="2" strokeLinecap="round" strokeLinejoin="round">
        <path stroke="none" d="M0 0h24v24H0z" fill="none" />
        <path d="M3 5a2 2 0 0 1 2 -2h14a2 2 0 0 1 2 2v14a2 2 0 0 1 -2 2h-14a2 2 0 0 1 -2 -2v-14" />
        <path d="M9 13h-2" />
        <path d="M13 10h-6" />
        <path d="M11 7h-4" />
      </svg>
  };
  const selectedIcon = icons[icon];
  if (!selectedIcon) {
    return null;
  }
  return selectedIcon;
};

## 차트 설정에 액세스

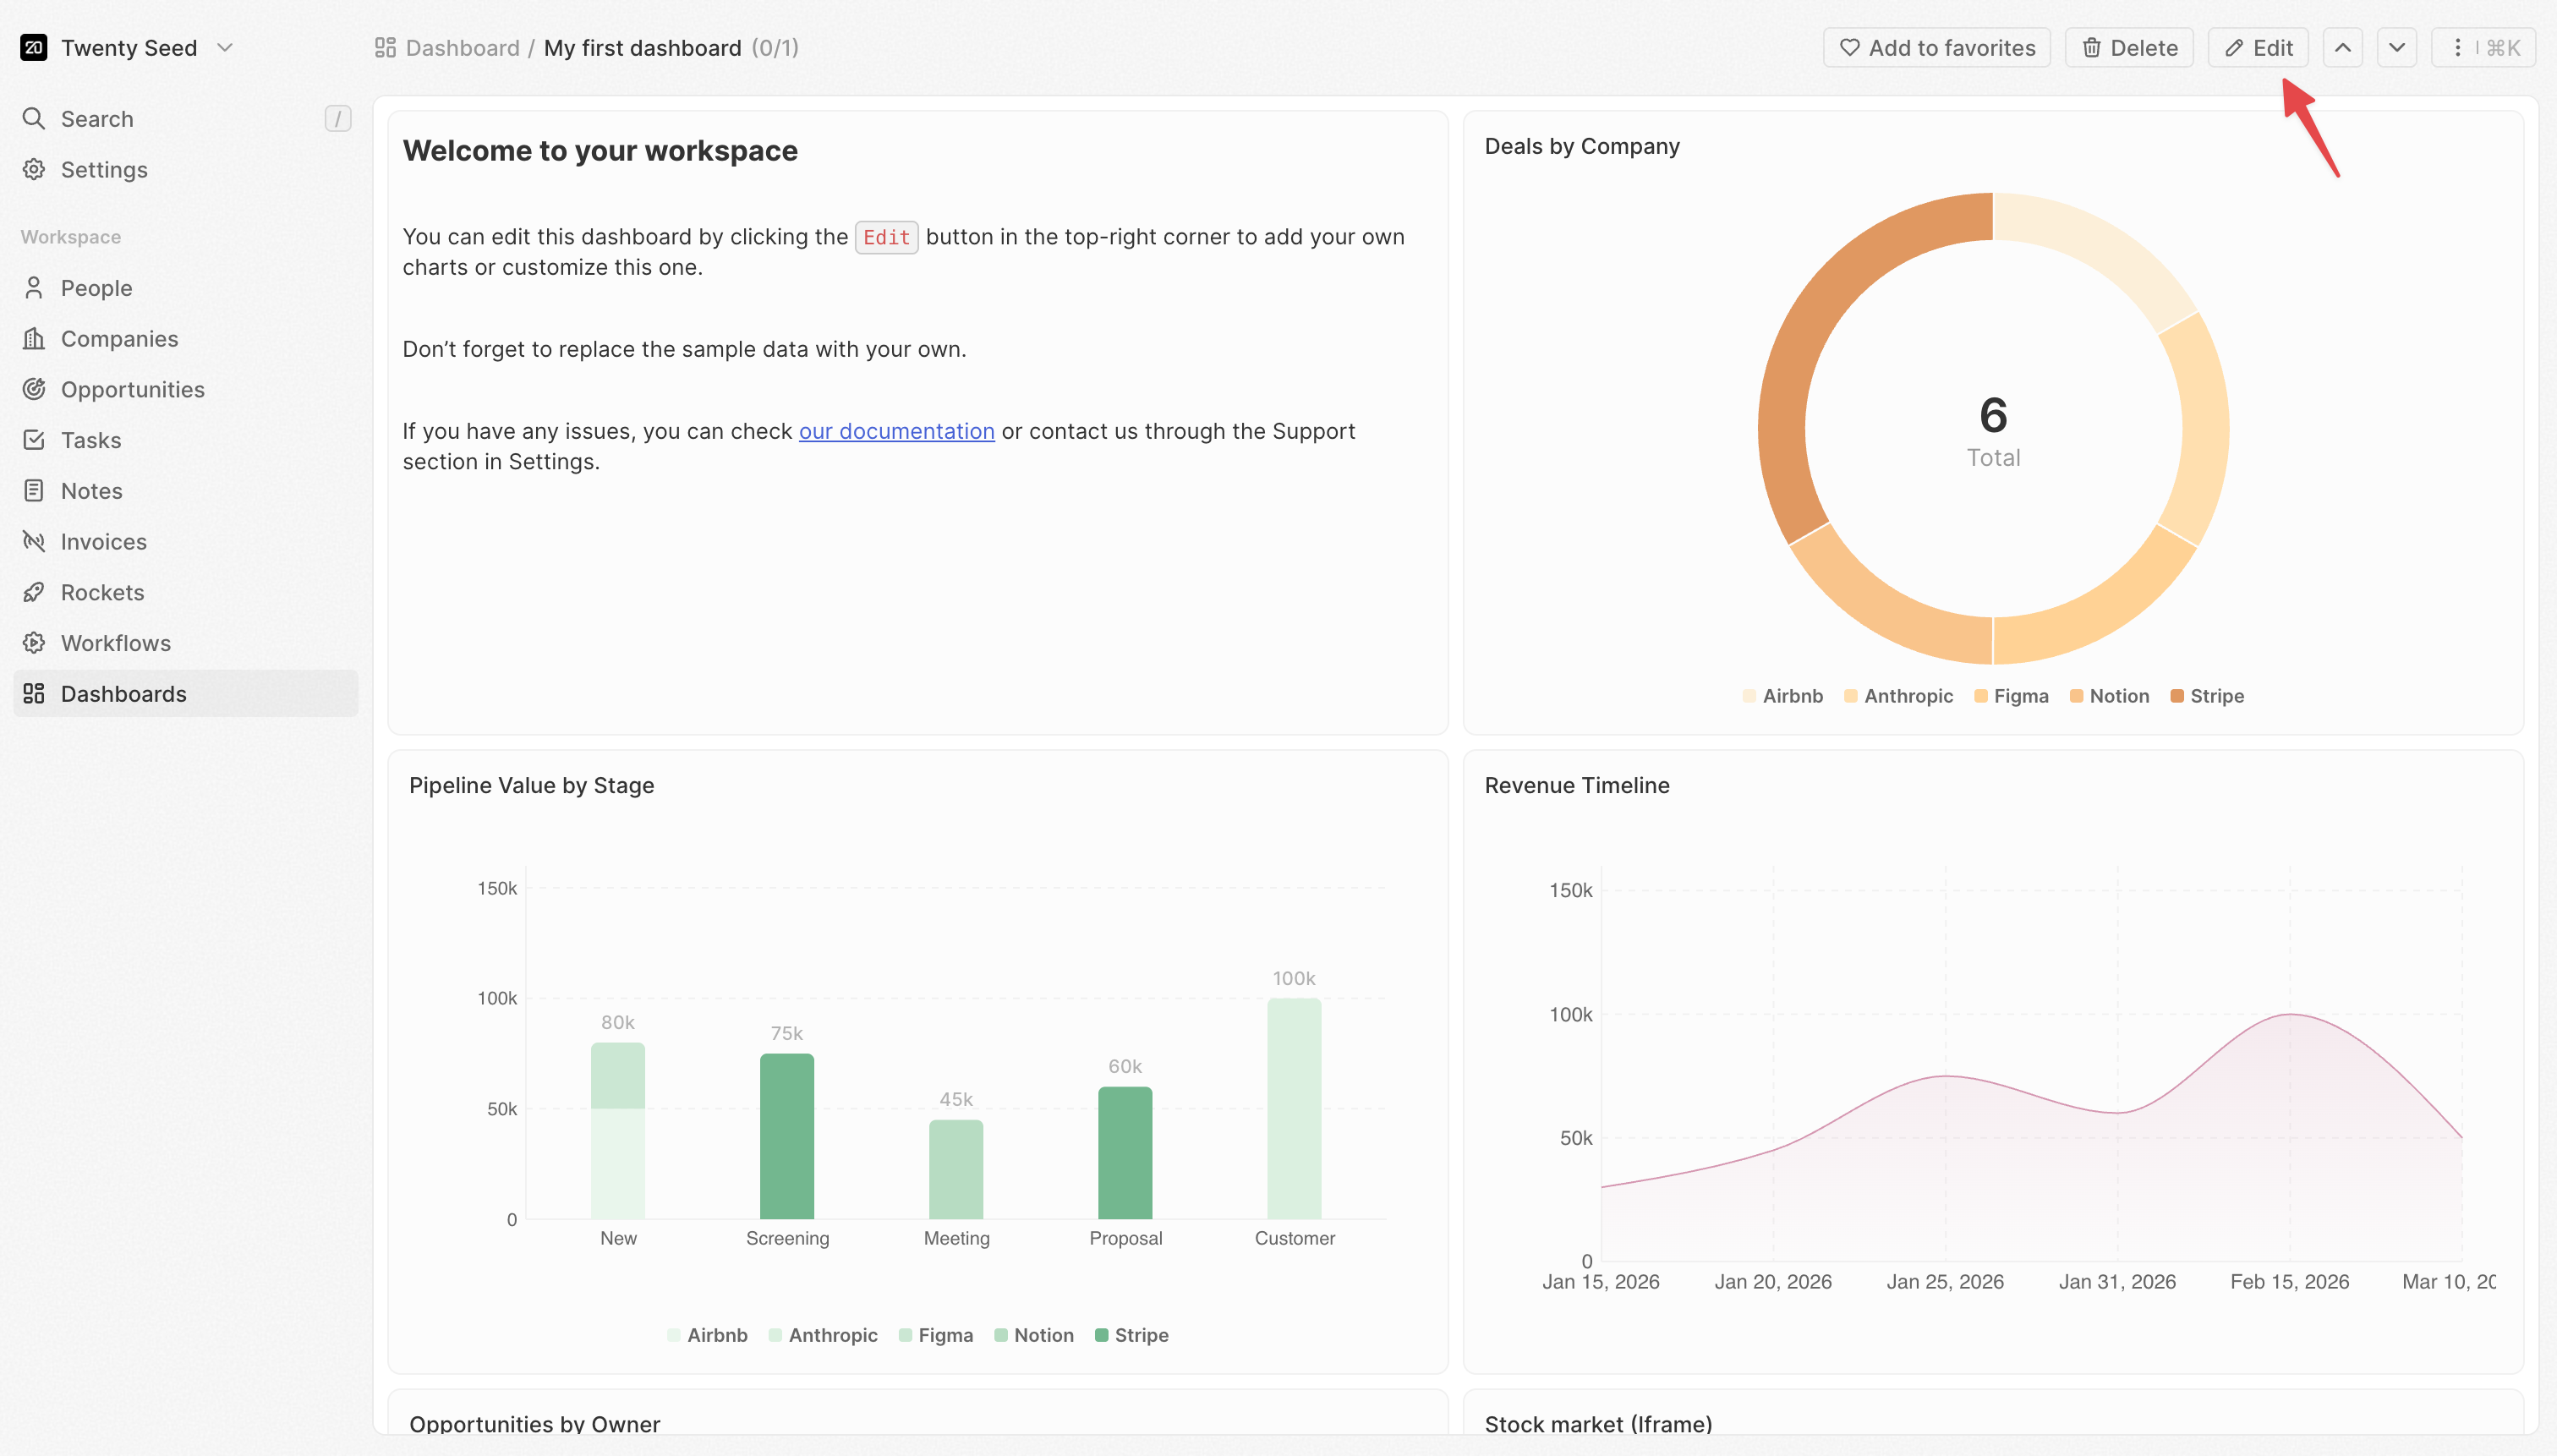
1. 대시보드 오른쪽 상단에서 **편집** 버튼을 클릭합니다

<img src="https://mintcdn.com/twenty/rtjyQTAh0DrLn5Sz/images/user-guide/dashboard/dashboard-edit.png?fit=max&auto=format&n=rtjyQTAh0DrLn5Sz&q=85&s=7e7c29f7cd1e15da39bbce586db5fc00" alt="편집 모드" width="3024" height="1722" data-path="images/user-guide/dashboard/dashboard-edit.png" />

2. 대시보드가 편집 모드로 전환됩니다
3. 아무 위젯이나 클릭하여 선택합니다
4. 오른쪽에 설정 패널이 열립니다

설정은 다음 섹션으로 구성됩니다:

* **데이터**: 가져올 데이터와 필터링 방법
* **X축**: 범주를 그룹화하고 정렬하는 방법(막대/선 차트)
* **Y축**: 무엇을 측정하고 어떻게 표시할지(막대/선 차트)
* **스타일**: 색상, 레이블, 시각적 옵션
<Note>
  일부 설정은 다른 설정이 구성되었을 때만 표시됩니다. 예를 들어, **날짜 세분성**은 날짜 필드를 선택했을 때만 표시됩니다.
</Note>

***

## 데이터 설정

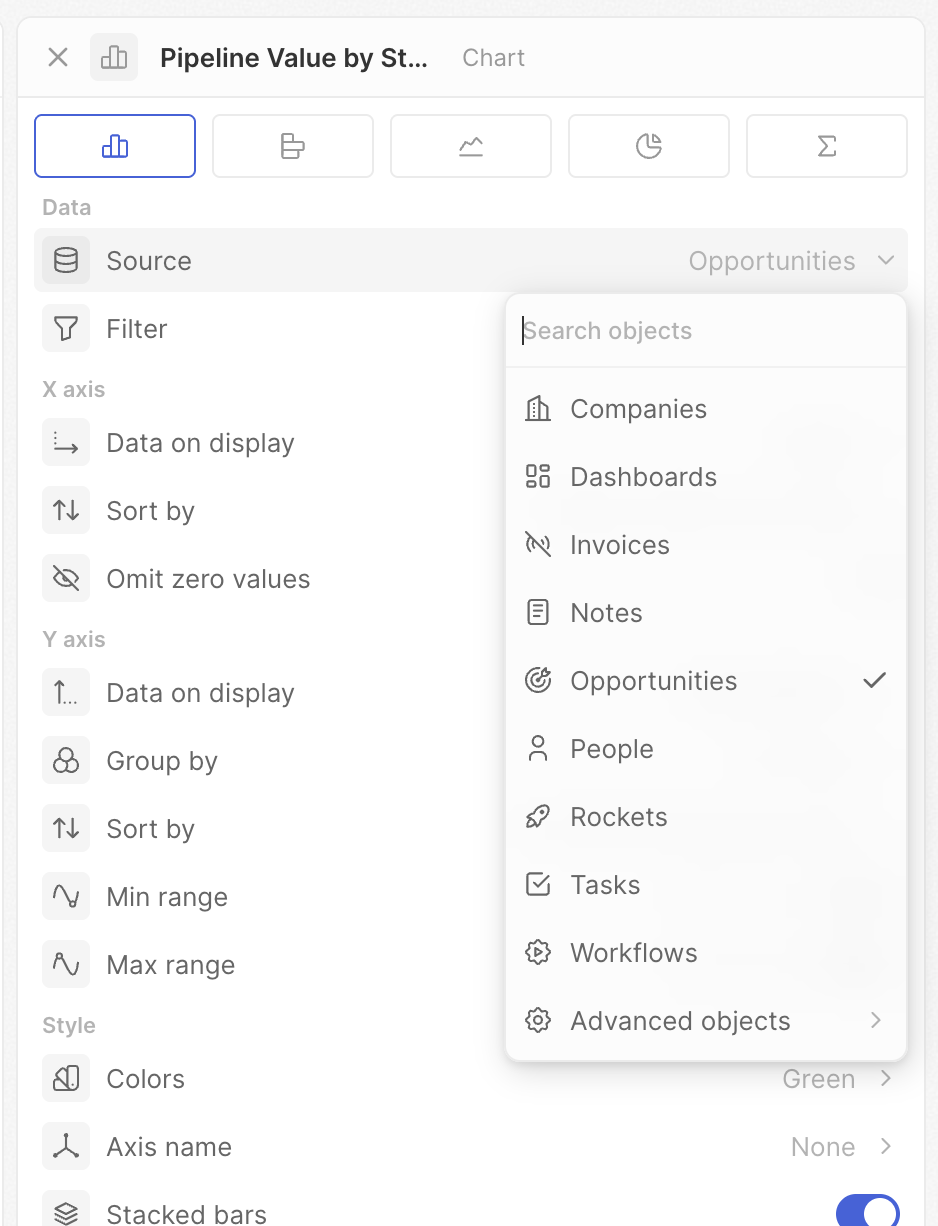
### <span style={{ display: 'inline-flex', alignItems: 'center', gap: '8px' }}> <ChartIcon icon="database" />소스 </span>

데이터를 가져올 객체를 선택합니다.

1. **소스**를 클릭합니다
2. 객체를 선택합니다(기회, 사람, 회사 등).

모든 표준 및 사용자 지정 객체를 사용할 수 있습니다. 선택한 객체에 따라 필드 옵션이 달라지므로 소스를 변경하면 다른 설정이 초기화됩니다.

<img src="https://mintcdn.com/twenty/rtjyQTAh0DrLn5Sz/images/user-guide/dashboard/dashboard-chart-settings-source.png?fit=max&auto=format&n=rtjyQTAh0DrLn5Sz&q=85&s=35db0497e477be353b26da56b595f45e" alt="소스" width="938" height="1226" data-path="images/user-guide/dashboard/dashboard-chart-settings-source.png" />

### <span style={{ display: 'inline-flex', alignItems: 'center', gap: '8px' }}> <ChartIcon icon="filter" />필터 </span>

차트에 포함할 레코드를 제한합니다.

1. **필터**를 클릭합니다
2. 필터 빌더가 열립니다
3. **+ 필터 추가**를 클릭합니다
4. 필드, 조건, 값을 선택합니다
5. 필요에 따라 필터를 더 추가합니다

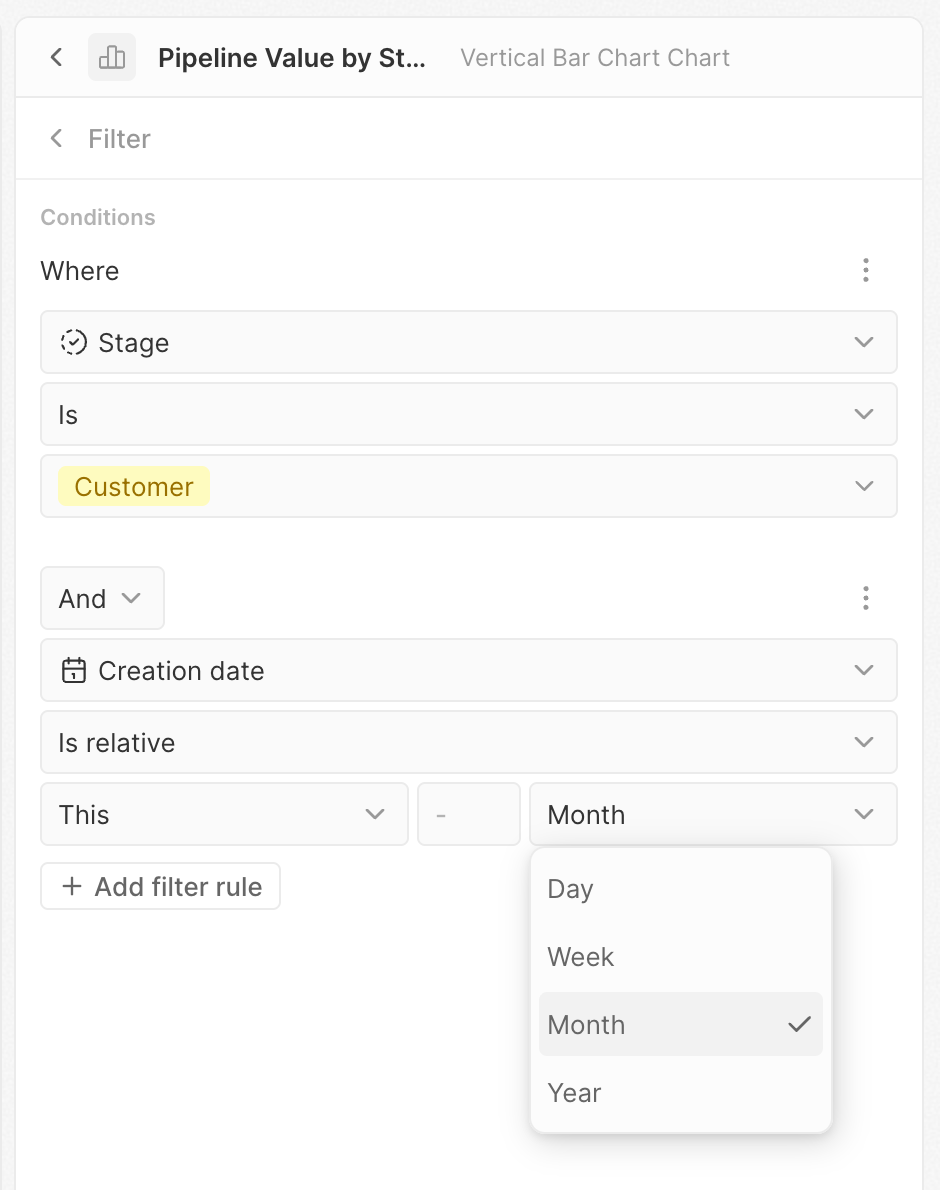
필터는 테이블 보기에서와 동일하게 동작합니다. 이를 사용해 데이터의 특정 세그먼트에 집중하세요.

**예시**: 단계가 "Won"인 기회만 필터링하여 성사된 거래만 표시합니다.

<img src="https://mintcdn.com/twenty/rtjyQTAh0DrLn5Sz/images/user-guide/dashboard/dashboard-chart-settings-filters.png?fit=max&auto=format&n=rtjyQTAh0DrLn5Sz&q=85&s=3b8505dba7d329779cb2163e23771422" alt="필터" width="940" height="1190" data-path="images/user-guide/dashboard/dashboard-chart-settings-filters.png" />

<Tip>
  날짜 필드의 경우, 자동으로 업데이트되는 "지난 7일" 또는 "이번 달"과 같은 동적 필터를 만들려면 **Is relative**를 사용해 보세요.
</Tip>

<Tip>
  고급 필터를 지원합니다—여러 필터 규칙을 추가하고 **And** 또는 **Or** 로직으로 결합하세요.
</Tip>

***

## X축 설정

이 설정은 막대 및 선 차트의 가로축을 제어하며, 일반적으로 데이터가 범주로 그룹화되는 방식을 결정합니다.

### <span style={{ display: 'inline-flex', alignItems: 'center', gap: '8px' }}> <ChartIcon icon="axis-x" />표시할 데이터 </span>

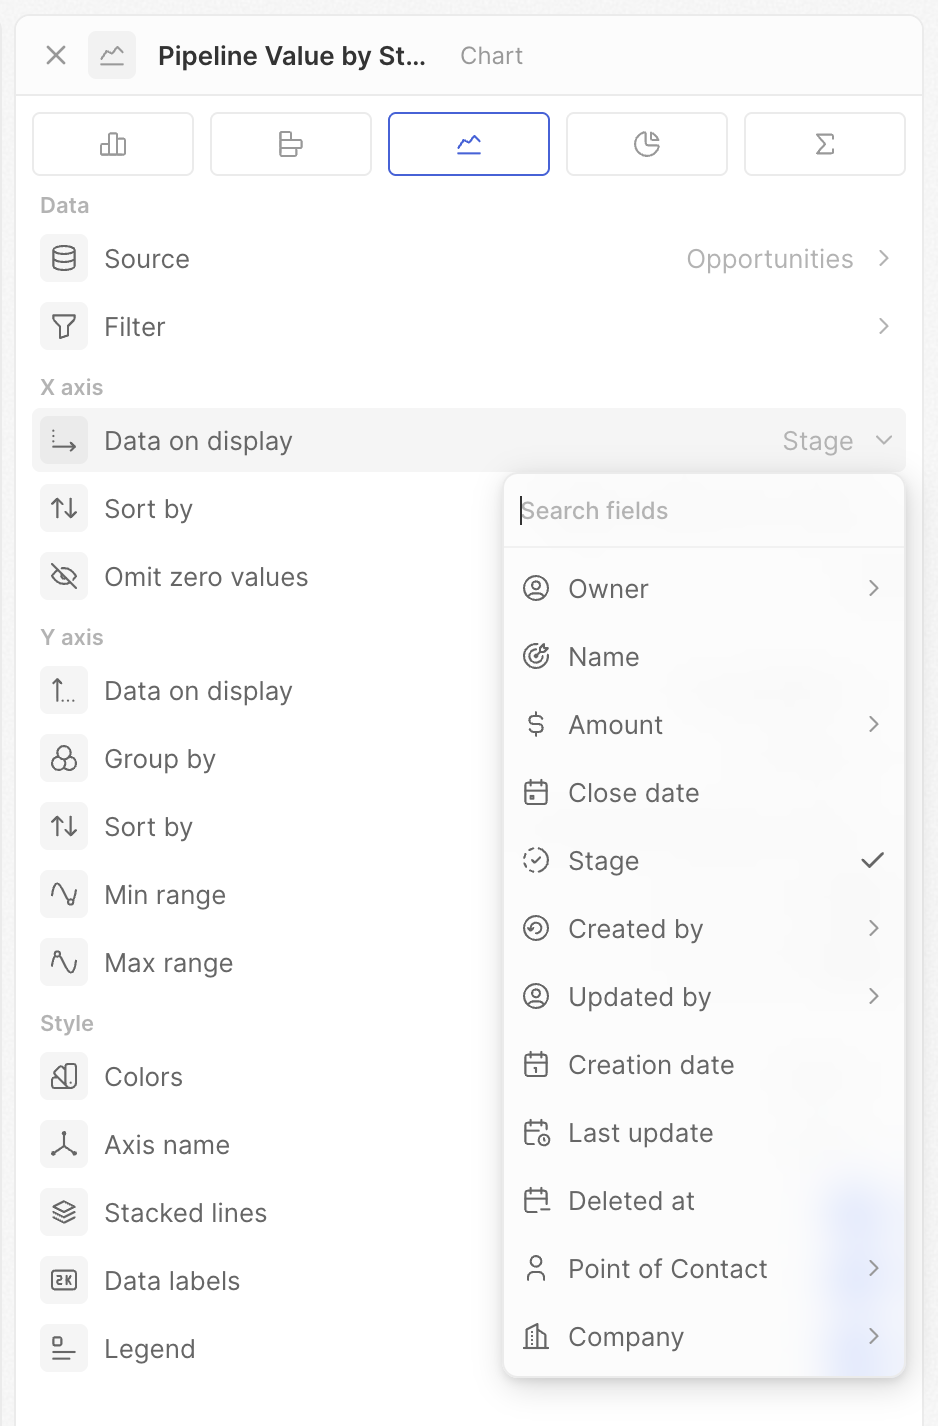
데이터를 그룹화할 필드를 선택합니다. X축에 표시될 범주가 결정됩니다.

**예시**: "Stage"를 선택하면 파이프라인 단계별로 그룹화된 데이터를, "Created date"를 선택하면 시간 경과에 따른 데이터를 볼 수 있습니다.

<img src="https://mintcdn.com/twenty/rtjyQTAh0DrLn5Sz/images/user-guide/dashboard/dashboard-chart-settings-x-data-on-display.png?fit=max&auto=format&n=rtjyQTAh0DrLn5Sz&q=85&s=5f3b48779f7f70a67416e9dd84b0a416" alt="표시된 데이터" width="938" height="1426" data-path="images/user-guide/dashboard/dashboard-chart-settings-x-data-on-display.png" />

### <span style={{ display: 'inline-flex', alignItems: 'center', gap: '8px' }}> <ChartIcon icon="calendar" />날짜 세분성 </span>

날짜 필드로 그룹화할 때 그룹화 기간을 선택합니다.

| 옵션         | 그룹화 기준   | 출력 예                     |
| ---------- | -------- | ------------------------ |
| **일**      | 각 날짜     | 1월 1일, 1월 2일, 1월 3일...   |
| **주**      | 달력 기준 주  | 1주차, 2주차, 3주차...         |
| **월**      | 달력 기준 월  | 1월, 2월, 3월...            |
| **분기**     | 회계 분기    | Q1, Q2, Q3, Q4           |
| **연도**     | 달력 기준 연도 | 2023, 2024, 2025         |
| **요일**     | 요일(집계)   | 월요일, 화요일... (모든 월요일 합산)  |
| **연도의 달**  | 월(집계)    | 1월, 2월... (모든 1월 합산)     |
| **연도의 분기** | 분기(집계)   | Q1, Q2, Q3, Q4(모든 Q1 합산) |

"요일/연도 기준" 옵션은 전체 기간에 걸쳐 집계됩니다. **요일**을 사용하면 어떤 요일에 거래가 가장 많은지 확인할 수 있습니다. **월**을 사용하면 월별 추세를 볼 수 있습니다.

### <span style={{ display: 'inline-flex', alignItems: 'center', gap: '8px' }}> <ChartIcon icon="arrows-sort" />정렬 기준 </span>

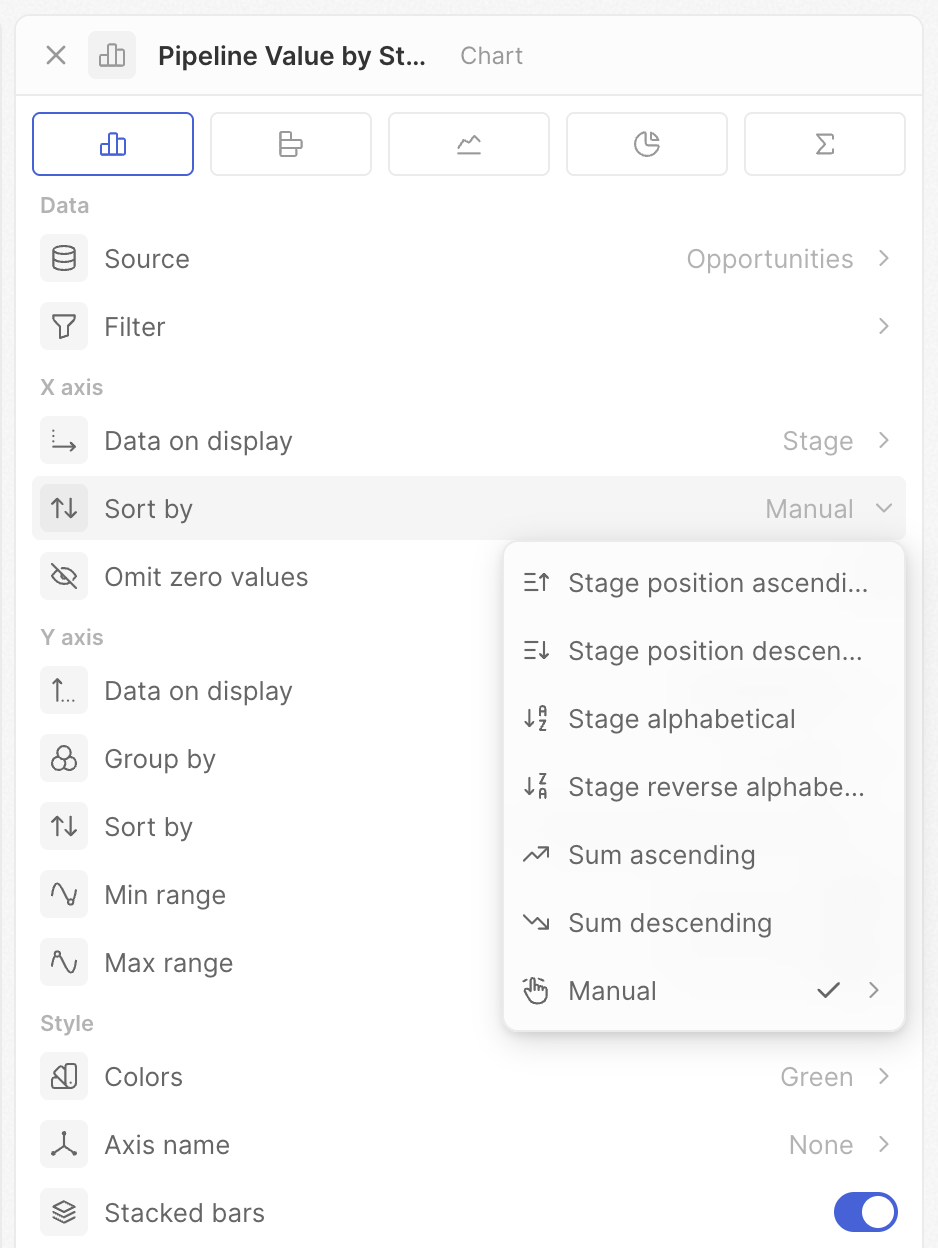
X축의 범주 순서를 제어합니다.

* **위치** – Select 필드 설정에 정의된 순서를 사용
* **알파벳순** – A에서 Z까지(날짜는 시간순)
* **값 기준** – 지표값으로 정렬(최대 또는 최소 우선)
* **수동** – 드래그하여 사용자 지정 순서로 설정

<img src="https://mintcdn.com/twenty/rtjyQTAh0DrLn5Sz/images/user-guide/dashboard/dashboard-chart-settings-x-sort.png?fit=max&auto=format&n=rtjyQTAh0DrLn5Sz&q=85&s=a899892608d18d0e617723786d9fa646" alt="정렬 기준" width="938" height="1248" data-path="images/user-guide/dashboard/dashboard-chart-settings-x-sort.png" />

**팁**: 파이프라인 단계에는 **위치**를 사용하여 영업 프로세스 순서(Lead → Qualified → Proposal → Won)대로 표시하세요.
<Note>
  표시되는 옵션은 필드 유형에 따라 다릅니다. Select 필드는 모든 옵션을 제공하지만 날짜 및 텍스트 필드는 더 적습니다.
</Note>

<Tip>
  수동 정렬에서는 범주를 드래그해 사용자 지정 순서를 만들 수 있습니다—특정 세그먼트를 강조하거나 데이터로 스토리를 전달하는 데 완벽합니다.
</Tip>

### <span style={{ display: 'inline-flex', alignItems: 'center', gap: '8px' }}> <ChartIcon icon="eye-off" />0 값 제외 </span>

값이 0이거나 데이터가 없는 범주를 숨깁니다.

* **켜짐**: 레코드가 없는 범주를 숨김
* **꺼짐**: 비어 있어도 모든 범주를 표시

희소한 데이터가 있는 차트를 정리하는 데 사용합니다.

***

## Y축 설정

측정 항목과 표시 방식을 제어합니다.

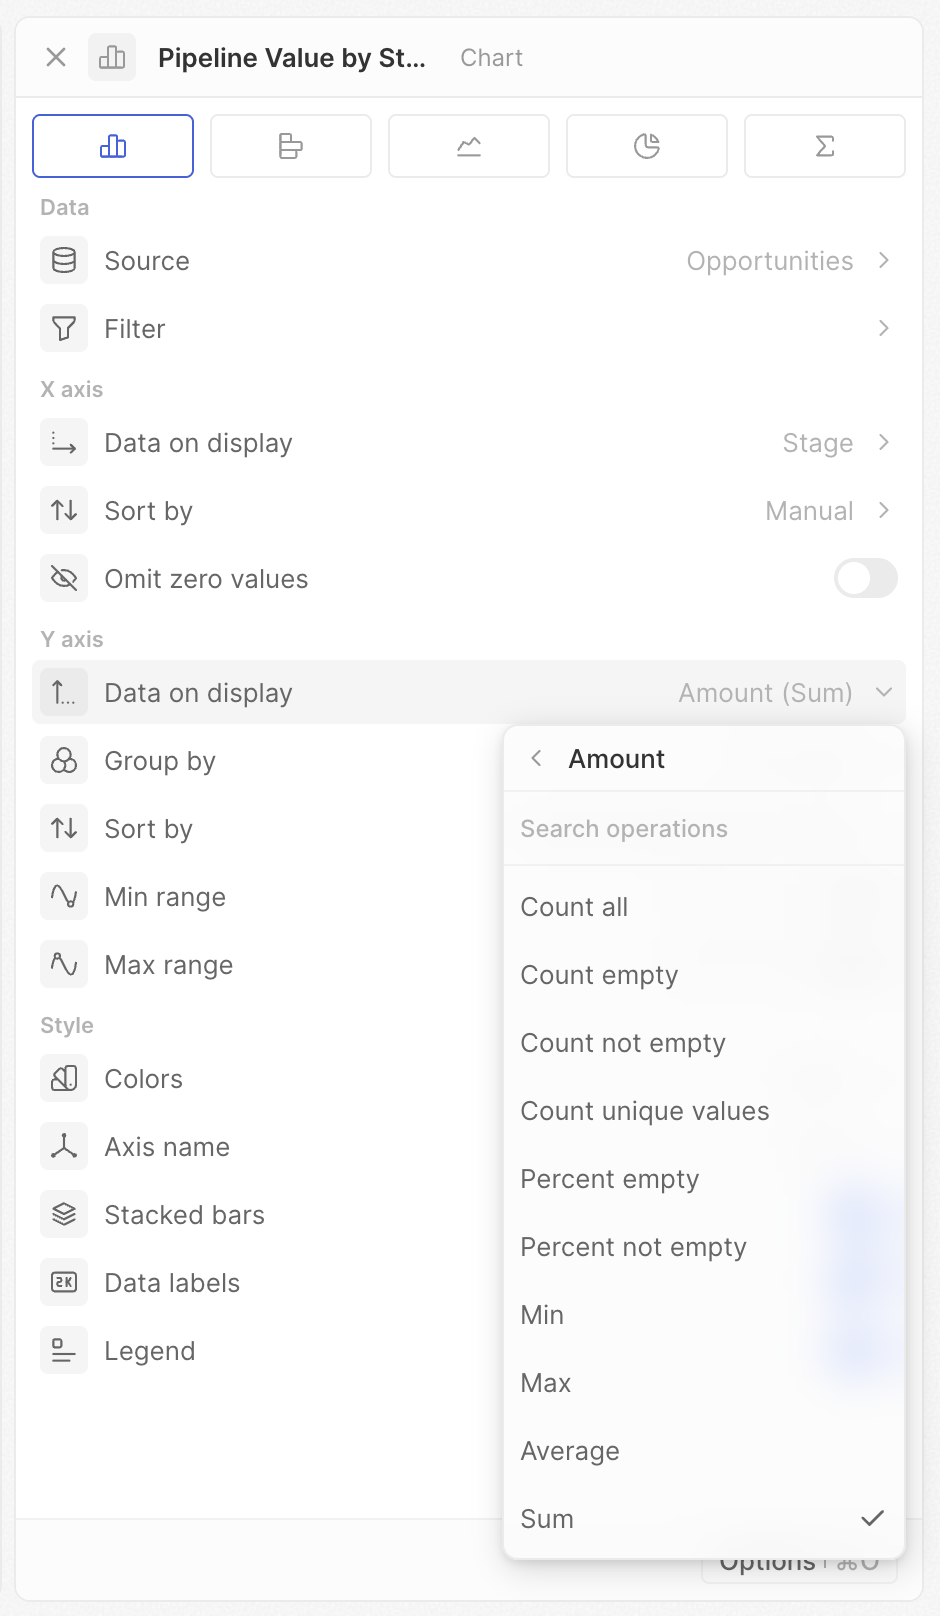
### <span style={{ display: 'inline-flex', alignItems: 'center', gap: '8px' }}> <ChartIcon icon="axis-y" />표시할 데이터 </span>

지표를 계산할 필드와 연산을 선택합니다.

* **개수** – 전체 개수, 비어 있음 개수, 비어 있지 않음 개수, 고유 값 개수
* **수학** – 합계, 평균, 최솟값, 최댓값(숫자 필드)
* **백분율** – 비어 있음 비율, 비어 있지 않음 비율

Boolean 필드에는 true/false 개수 옵션이 추가됩니다. 날짜 필드가 있는 집계 차트에는 Earliest/Latest가 표시됩니다.

**예시**: "Amount"에 합계를 선택하면 범주별 총 거래 금액을, 전체 개수를 선택하면 거래 수를 볼 수 있습니다.

<img src="https://mintcdn.com/twenty/rtjyQTAh0DrLn5Sz/images/user-guide/dashboard/dashboard-chart-settings-y-data-on-display.png?fit=max&auto=format&n=rtjyQTAh0DrLn5Sz&q=85&s=3ec4d55b8d52a6e62dce4246daf44386" alt="표시된 데이터" width="940" height="1616" data-path="images/user-guide/dashboard/dashboard-chart-settings-y-data-on-display.png" />

<Note>
  표시되는 옵션은 필드 및 차트 유형에 따라 다릅니다. 예상한 연산이 보이지 않으면 필드 유형을 확인하세요.
</Note>

### 비율

Select, Multi-select 또는 Boolean 필드의 경우 특정 값의 비율을 계산할 수 있습니다.

1. Select, Multi-select 또는 Boolean 필드를 선택합니다
2. **Ratio**를 활성화합니다
3. 측정할 옵션을 선택합니다

**예시**: 모든 기회 대비 "Won" 거래의 비율을 표시합니다. 총 50개 중 10개가 "Won"이라면 차트에는 20%가 표시됩니다.

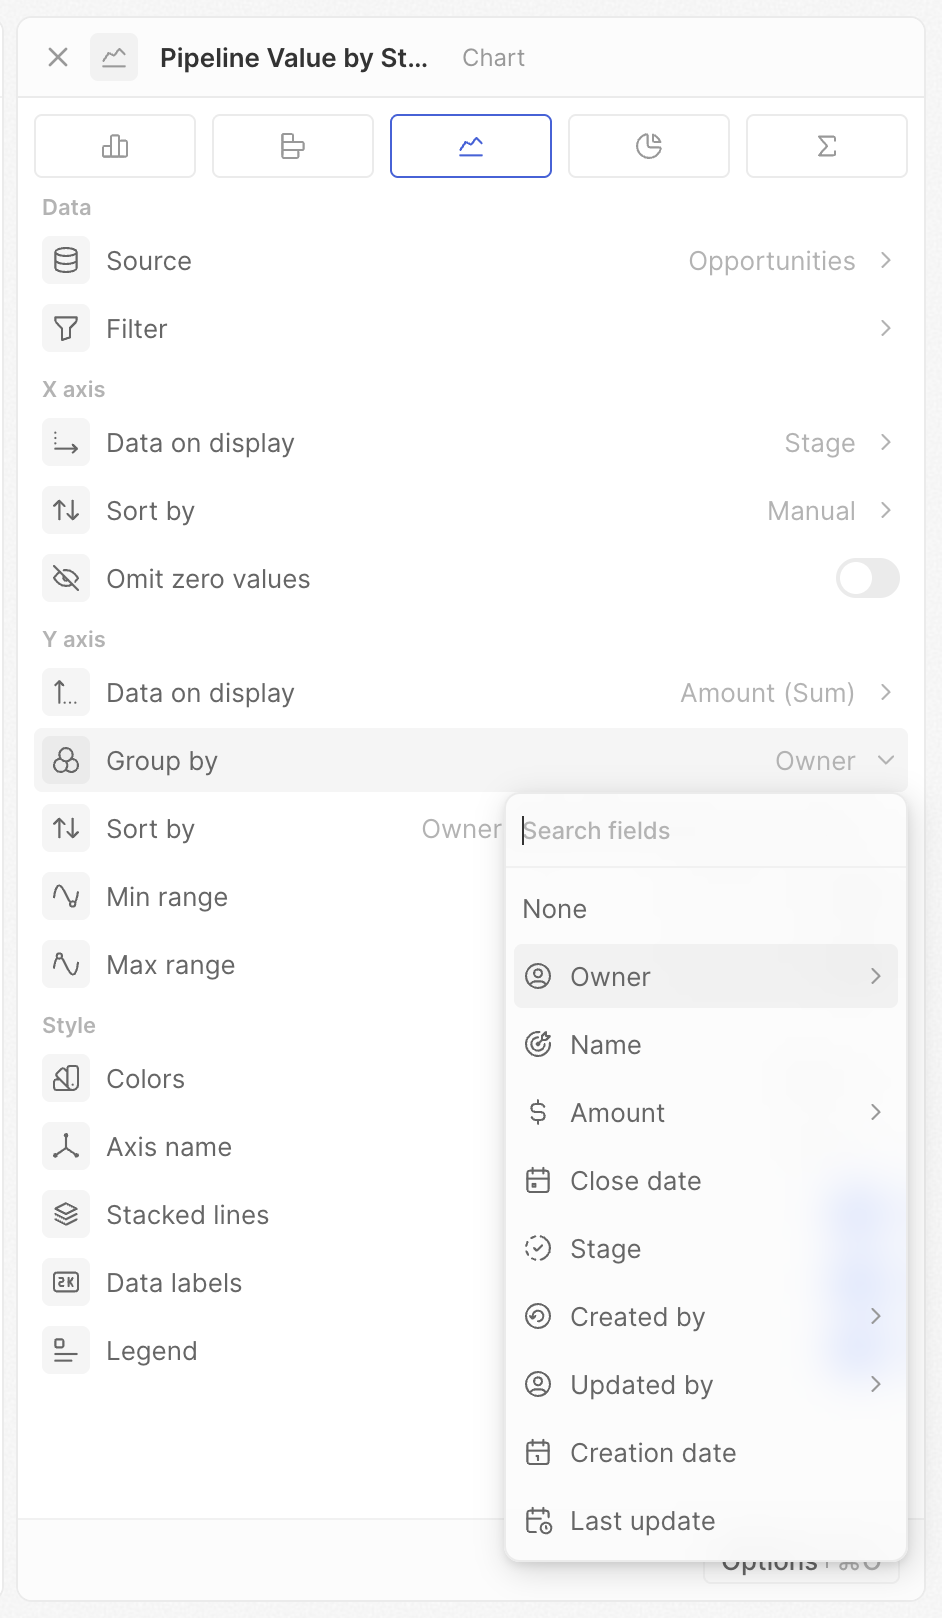
### <span style={{ display: 'inline-flex', alignItems: 'center', gap: '8px' }}> <ChartIcon icon="filters" />그룹화 기준 </span>

두 번째 차원을 추가해 다중 시리즈(여러 막대 또는 선)를 만듭니다.

1. 먼저 X축 필드를 설정합니다
2. **그룹화 기준**을 클릭합니다
3. 두 번째 필드를 선택합니다

**예시**: 단계(X축)와 소유자(그룹화 기준)로 거래를 그룹화하여 각 사람의 파이프라인 분포를 나란히 비교합니다.

<img src="https://mintcdn.com/twenty/rtjyQTAh0DrLn5Sz/images/user-guide/dashboard/dashboard-chart-settings-y-group-by.png?fit=max&auto=format&n=rtjyQTAh0DrLn5Sz&q=85&s=fc136966d521c9d97d71aef816a0e46e" alt="그룹별" width="942" height="1618" data-path="images/user-guide/dashboard/dashboard-chart-settings-y-group-by.png" />

그룹화 기준을 설정하면 차트에 여러 색상이 표시되고 범례가 나타납니다.

### <span style={{ display: 'inline-flex', alignItems: 'center', gap: '8px' }}> <ChartIcon icon="calendar" />날짜 세분성 </span>
그룹화 기준이 날짜 필드일 때 기간을 선택합니다(X축과 동일한 옵션).

### <span style={{ display: 'inline-flex', alignItems: 'center', gap: '8px' }}> <ChartIcon icon="arrows-sort" />정렬 기준 </span>

그룹화 기준이 설정된 경우, 그룹 시리즈의 표시 순서를 제어합니다(예: 각 범주 안에서 어떤 소유자의 막대가 먼저 나타날지).

X축 정렬과 동일한 옵션(위치, 알파벳순, 수동)을 사용할 수 있지만, 보조 그룹화에는 값 기준 정렬을 사용할 수 없습니다.

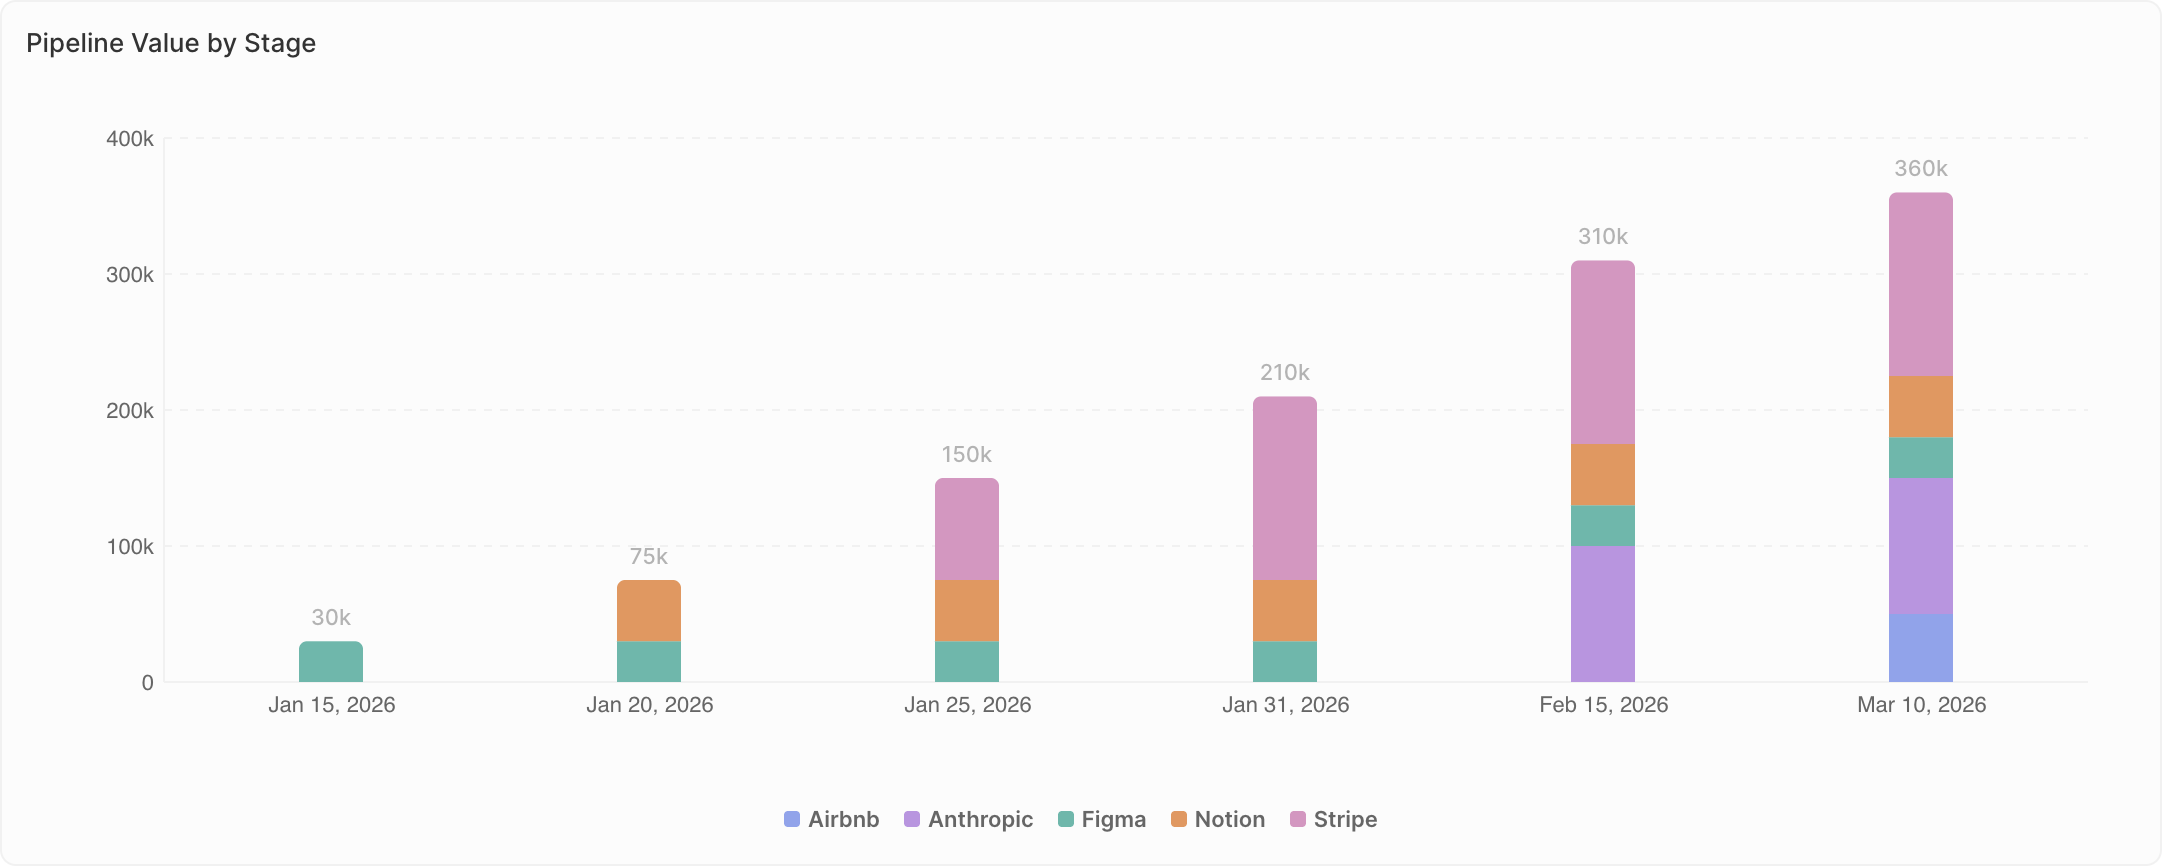
### <span style={{ display: 'inline-flex', alignItems: 'center', gap: '8px' }}> <ChartIcon icon="chart-bar-popular" />누적 </span>

개별 값 대신 누적 합계를 표시합니다.

* **꺼짐**: 각 막대/포인트가 자신의 값을 표시
* **켜짐**: 각 막대/포인트가 이전 값들의 합계에 자신의 값을 더한 값을 표시

**예시**: 1월 = 10, 2월 = 15

* 누적 꺼짐: 10과 15를 표시
* 누적 켜짐: 10과 25(10 + 15)를 표시

누적을 사용해 시간 경과에 따른 목표 달성 진행도를 추적하세요.

<img src="https://mintcdn.com/twenty/rtjyQTAh0DrLn5Sz/images/user-guide/dashboard/dashboard-chart-settings-y-cumulative.png?fit=max&auto=format&n=rtjyQTAh0DrLn5Sz&q=85&s=c42268a10b32a38ccba1da90074a48ed" alt="누적" width="2164" height="868" data-path="images/user-guide/dashboard/dashboard-chart-settings-y-cumulative.png" />

### <span style={{ display: 'inline-flex', alignItems: 'center', gap: '8px' }}> <ChartIcon icon="math-min" />최솟값 범위 / <ChartIcon icon="math-max" />최댓값 범위 </span>

Y축의 최소/최대 값을 고정합니다.

* 비워 두면 자동 스케일링
* 숫자를 입력해 경계를 고정합니다

**사용 시점:**

* 정확한 시각적 비교를 위해 최소값을 0으로 설정하세요
* 여러 차트에서 일관된 축 범위를 위해 둘 다 설정하세요
* 둘 다 설정하여 특정 값 범위에 집중하세요

***

## 스타일 설정

### <span style={{ display: 'inline-flex', alignItems: 'center', gap: '8px' }}> <ChartIcon icon="color-swatch" />색상 </span>

차트의 색 구성표를 설정합니다. 다양한 색상 팔레트 중에서 선택합니다.

<Note>
  Select 필드로 그룹화하는 경우 차트는 필드 설정에서 각 옵션에 정의된 색상을 자동으로 사용합니다.
</Note>

### <span style={{ display: 'inline-flex', alignItems: 'center', gap: '8px' }}> <ChartIcon icon="gizmo" />축 이름 </span>

표시할 축 레이블을 선택합니다: **없음**, **X축**, **Y축**, 또는 **둘 다**(막대 및 선 차트 전용).

### <span style={{ display: 'inline-flex', alignItems: 'center', gap: '8px' }}> <ChartIcon icon="stack-2" />누적 막대 / 누적 선 </span>

그룹화가 설정된 경우 다중 시리즈의 표시 방식을 선택합니다.

* **꺼짐(그룹형)**: 시리즈가 나란히 표시됩니다. 그룹 간 정확한 값을 비교할 때 사용합니다.
* **켜짐(누적형)**: 시리즈가 위로 겹쳐 누적되어 표시됩니다. 부분이 전체를 어떻게 구성하는지(구성 비율)를 보여줄 때 사용합니다.

**예시**: 단계별 거래, 소유자 기준 그룹화

* 그룹형: 각 소유자의 정확한 수치를 나란히 확인
* 누적형: 단계별 총 거래 수와 각 소유자의 기여도를 누적으로 확인

### <span style={{ display: 'inline-flex', alignItems: 'center', gap: '8px' }}> <ChartIcon icon="badge-2k" />데이터 레이블 </span>

차트 요소(막대, 포인트, 조각)에 값을 직접 표시합니다.

* **켜짐**: 값이 차트에 표시됩니다
* **꺼짐**: 값이 표시되지 않습니다(더 깔끔함)

### <span style={{ display: 'inline-flex', alignItems: 'center', gap: '8px' }}> <ChartIcon icon="text-caption" />범례 </span>

범례를 표시하거나 숨깁니다(그룹화가 설정된 경우에만 표시).

* **켜짐**: 각 색상이 의미하는 바를 범례에 표시
* **꺼짐**: 범례를 표시하지 않음

<Tip>
  **범례 항목 위에 마우스를 올리면** 해당 그룹이 강조 표시됩니다. **클릭**하여 차트에서 일시적으로 숨깁니다.
</Tip>

***

## 차트별 참고 사항

### 파이 차트

* <span style={{ display: 'inline-flex', verticalAlign: 'middle' }}><ChartIcon icon="chart-pie" size={16} /></span> **각 조각이 나타내는 것** – 조각의 그룹화 기준을 정의
* <span style={{ display: 'inline-flex', verticalAlign: 'middle' }}><ChartIcon icon="eye-off" size={16} /></span> **빈 범주 숨기기** – 값이 0인 조각 제거
* <span style={{ display: 'inline-flex', verticalAlign: 'middle' }}><ChartIcon icon="number-123" size={16} /></span> **가운데에 값 표시** – 집계 값(합계, 평균, 개수 등) 표시

### 집계 차트

* <span style={{ display: 'inline-flex', verticalAlign: 'middle' }}><ChartIcon icon="caret-left" size={16} /></span> **접두사** – 숫자 앞에 텍스트 추가(예: `$`)
* <span style={{ display: 'inline-flex', verticalAlign: 'middle' }}><ChartIcon icon="caret-right" size={16} /></span> **접미사** – 숫자 뒤에 텍스트 추가(예: `%`)