> ## Documentation Index
> Fetch the complete documentation index at: https://docs.twenty.com/llms.txt
> Use this file to discover all available pages before exploring further.

# Widgeturi

> Explorați tipurile de widgeturi și opțiunile de vizualizare din Twenty.

export const ChartIcon = ({icon, size = 20}) => {
  const icons = {
    'database': <svg xmlns="http://www.w3.org/2000/svg" width={size} height={size} viewBox="0 0 24 24" fill="none" stroke="currentColor" strokeWidth="2" strokeLinecap="round" strokeLinejoin="round">
        <path stroke="none" d="M0 0h24v24H0z" fill="none" />
        <path d="M4 6a8 3 0 1 0 16 0a8 3 0 1 0 -16 0" />
        <path d="M4 6v6a8 3 0 0 0 16 0v-6" />
        <path d="M4 12v6a8 3 0 0 0 16 0v-6" />
      </svg>,
    'filter': <svg xmlns="http://www.w3.org/2000/svg" width={size} height={size} viewBox="0 0 24 24" fill="none" stroke="currentColor" strokeWidth="2" strokeLinecap="round" strokeLinejoin="round">
        <path stroke="none" d="M0 0h24v24H0z" fill="none" />
        <path d="M4 4h16v2.172a2 2 0 0 1 -.586 1.414l-4.414 4.414v7l-6 2v-8.5l-4.48 -4.928a2 2 0 0 1 -.52 -1.345v-2.227" />
      </svg>,
    'axis-x': <svg xmlns="http://www.w3.org/2000/svg" width={size} height={size} viewBox="0 0 24 24" fill="none" stroke="currentColor" strokeWidth="2" strokeLinecap="round" strokeLinejoin="round">
        <path stroke="none" d="M0 0h24v24H0z" fill="none" />
        <path d="M4 13v.01" />
        <path d="M4 9v.01" />
        <path d="M4 5v.01" />
        <path d="M17 20l3 -3l-3 -3" />
        <path d="M4 17h16" />
      </svg>,
    'axis-y': <svg xmlns="http://www.w3.org/2000/svg" width={size} height={size} viewBox="0 0 24 24" fill="none" stroke="currentColor" strokeWidth="2" strokeLinecap="round" strokeLinejoin="round">
        <path stroke="none" d="M0 0h24v24H0z" fill="none" />
        <path d="M11 20h-.01" />
        <path d="M15 20h-.01" />
        <path d="M19 20h-.01" />
        <path d="M4 7l3 -3l3 3" />
        <path d="M7 20v-16" />
      </svg>,
    'sum': <svg xmlns="http://www.w3.org/2000/svg" width={size} height={size} viewBox="0 0 24 24" fill="none" stroke="currentColor" strokeWidth="2" strokeLinecap="round" strokeLinejoin="round">
        <path stroke="none" d="M0 0h24v24H0z" fill="none" />
        <path d="M18 16v2a1 1 0 0 1 -1 1h-11l6 -7l-6 -7h11a1 1 0 0 1 1 1v2" />
      </svg>,
    'chart-pie': <svg xmlns="http://www.w3.org/2000/svg" width={size} height={size} viewBox="0 0 24 24" fill="none" stroke="currentColor" strokeWidth="2" strokeLinecap="round" strokeLinejoin="round">
        <path stroke="none" d="M0 0h24v24H0z" fill="none" />
        <path d="M10 3.2a9 9 0 1 0 10.8 10.8a1 1 0 0 0 -1 -1h-6.8a2 2 0 0 1 -2 -2v-7a.9 .9 0 0 0 -1 -.8" />
        <path d="M15 3.5a9 9 0 0 1 5.5 5.5h-4.5a1 1 0 0 1 -1 -1v-4.5" />
      </svg>,
    'chart-line': <svg xmlns="http://www.w3.org/2000/svg" width={size} height={size} viewBox="0 0 24 24" fill="none" stroke="currentColor" strokeWidth="2" strokeLinecap="round" strokeLinejoin="round">
        <path stroke="none" d="M0 0h24v24H0z" fill="none" />
        <path d="M4 19l16 0" />
        <path d="M4 15l4 -6l4 2l4 -5l4 4" />
      </svg>,
    'calendar': <svg xmlns="http://www.w3.org/2000/svg" width={size} height={size} viewBox="0 0 24 24" fill="none" stroke="currentColor" strokeWidth="2" strokeLinecap="round" strokeLinejoin="round">
        <path stroke="none" d="M0 0h24v24H0z" fill="none" />
        <path d="M4 7a2 2 0 0 1 2 -2h12a2 2 0 0 1 2 2v12a2 2 0 0 1 -2 2h-12a2 2 0 0 1 -2 -2v-12" />
        <path d="M16 3v4" />
        <path d="M8 3v4" />
        <path d="M4 11h16" />
        <path d="M11 15h1" />
        <path d="M12 15v3" />
      </svg>,
    'arrows-sort': <svg xmlns="http://www.w3.org/2000/svg" width={size} height={size} viewBox="0 0 24 24" fill="none" stroke="currentColor" strokeWidth="2" strokeLinecap="round" strokeLinejoin="round">
        <path stroke="none" d="M0 0h24v24H0z" fill="none" />
        <path d="M3 9l4 -4l4 4m-4 -4v14" />
        <path d="M21 15l-4 4l-4 -4m4 4v-14" />
      </svg>,
    'filters': <svg xmlns="http://www.w3.org/2000/svg" width={size} height={size} viewBox="0 0 24 24" fill="none" stroke="currentColor" strokeWidth="2" strokeLinecap="round" strokeLinejoin="round">
        <path stroke="none" d="M0 0h24v24H0z" fill="none" />
        <path d="M7 8a5 5 0 1 0 10 0a5 5 0 1 0 -10 0" />
        <path d="M8 11a5 5 0 1 0 3.998 1.997" />
        <path d="M12.002 19.003a5 5 0 1 0 3.998 -8.003" />
      </svg>,
    'chart-bar-popular': <svg xmlns="http://www.w3.org/2000/svg" width={size} height={size} viewBox="0 0 24 24" fill="none" stroke="currentColor" strokeWidth="2" strokeLinecap="round" strokeLinejoin="round">
        <path stroke="none" d="M0 0h24v24H0z" fill="none" />
        <path d="M3 13a1 1 0 0 1 1 -1h4a1 1 0 0 1 1 1v6a1 1 0 0 1 -1 1h-4a1 1 0 0 1 -1 -1l0 -6" />
        <path d="M9 9a1 1 0 0 1 1 -1h4a1 1 0 0 1 1 1v10a1 1 0 0 1 -1 1h-4a1 1 0 0 1 -1 -1l0 -10" />
        <path d="M15 5a1 1 0 0 1 1 -1h4a1 1 0 0 1 1 1v14a1 1 0 0 1 -1 1h-4a1 1 0 0 1 -1 -1l0 -14" />
        <path d="M4 20h14" />
      </svg>,
    'math-min': <svg xmlns="http://www.w3.org/2000/svg" width={size} height={size} viewBox="0 0 24 24" fill="none" stroke="currentColor" strokeWidth="2" strokeLinecap="round" strokeLinejoin="round">
        <path stroke="none" d="M0 0h24v24H0z" fill="none" />
        <path d="M15 18a2 2 0 1 0 4 0a2 2 0 0 0 -4 0" />
        <path d="M3 13s1 -9 4 -9c2.48 0 5.643 9.565 8.36 12.883" />
        <path d="M18.748 17.038c.702 -.88 1.452 -3.56 2.252 -8.038" />
      </svg>,
    'math-max': <svg xmlns="http://www.w3.org/2000/svg" width={size} height={size} viewBox="0 0 24 24" fill="none" stroke="currentColor" strokeWidth="2" strokeLinecap="round" strokeLinejoin="round">
        <path stroke="none" d="M0 0h24v24H0z" fill="none" />
        <path d="M5 6a2 2 0 1 0 4 0a2 2 0 0 0 -4 0" />
        <path d="M3 15s.616 -5.544 2.332 -7.93" />
        <path d="M8.637 7.112c2.717 3.313 5.882 12.888 8.363 12.888c2 0 3.333 -3 4 -9" />
      </svg>,
    'color-swatch': <svg xmlns="http://www.w3.org/2000/svg" width={size} height={size} viewBox="0 0 24 24" fill="none" stroke="currentColor" strokeWidth="2" strokeLinecap="round" strokeLinejoin="round">
        <path stroke="none" d="M0 0h24v24H0z" fill="none" />
        <path d="M19 3h-4a2 2 0 0 0 -2 2v12a4 4 0 0 0 8 0v-12a2 2 0 0 0 -2 -2" />
        <path d="M13 7.35l-2 -2a2 2 0 0 0 -2.828 0l-2.828 2.828a2 2 0 0 0 0 2.828l9 9" />
        <path d="M7.3 13h-2.3a2 2 0 0 0 -2 2v4a2 2 0 0 0 2 2h12" />
        <path d="M17 17l0 .01" />
      </svg>,
    'gizmo': <svg xmlns="http://www.w3.org/2000/svg" width={size} height={size} viewBox="0 0 24 24" fill="none" stroke="currentColor" strokeWidth="2" strokeLinecap="round" strokeLinejoin="round">
        <path stroke="none" d="M0 0h24v24H0z" fill="none" />
        <path d="M20 19l-8 -5.5l-8 5.5" />
        <path d="M12 4v9.5" />
        <path d="M11 4a1 1 0 1 0 2 0a1 1 0 1 0 -2 0" />
        <path d="M3 19a1 1 0 1 0 2 0a1 1 0 1 0 -2 0" />
        <path d="M19 19a1 1 0 1 0 2 0a1 1 0 1 0 -2 0" />
      </svg>,
    'stack-2': <svg xmlns="http://www.w3.org/2000/svg" width={size} height={size} viewBox="0 0 24 24" fill="none" stroke="currentColor" strokeWidth="2" strokeLinecap="round" strokeLinejoin="round">
        <path stroke="none" d="M0 0h24v24H0z" fill="none" />
        <path d="M12 4l-8 4l8 4l8 -4l-8 -4" />
        <path d="M4 12l8 4l8 -4" />
        <path d="M4 16l8 4l8 -4" />
      </svg>,
    'badge-2k': <svg xmlns="http://www.w3.org/2000/svg" width={size} height={size} viewBox="0 0 24 24" fill="none" stroke="currentColor" strokeWidth="2" strokeLinecap="round" strokeLinejoin="round">
        <path stroke="none" d="M0 0h24v24H0z" fill="none" />
        <path d="M3 7a2 2 0 0 1 2 -2h14a2 2 0 0 1 2 2v10a2 2 0 0 1 -2 2h-14a2 2 0 0 1 -2 -2l0 -10" />
        <path d="M14 9v6" />
        <path d="M17 9l-2 3l2 3" />
        <path d="M15 12h-1" />
        <path d="M7 9h2a1 1 0 0 1 1 1v1a1 1 0 0 1 -1 1h-1a1 1 0 0 0 -1 1v1a1 1 0 0 0 1 1h2" />
      </svg>,
    'text-caption': <svg xmlns="http://www.w3.org/2000/svg" width={size} height={size} viewBox="0 0 24 24" fill="none" stroke="currentColor" strokeWidth="2" strokeLinecap="round" strokeLinejoin="round">
        <path stroke="none" d="M0 0h24v24H0z" fill="none" />
        <path d="M4 15h16" />
        <path d="M4 5a1 1 0 0 1 1 -1h4a1 1 0 0 1 1 1v4a1 1 0 0 1 -1 1h-4a1 1 0 0 1 -1 -1l0 -4" />
        <path d="M4 20h12" />
      </svg>,
    'eye-off': <svg xmlns="http://www.w3.org/2000/svg" width={size} height={size} viewBox="0 0 24 24" fill="none" stroke="currentColor" strokeWidth="2" strokeLinecap="round" strokeLinejoin="round">
        <path stroke="none" d="M0 0h24v24H0z" fill="none" />
        <path d="M10.585 10.587a2 2 0 0 0 2.829 2.828" />
        <path d="M16.681 16.673a8.717 8.717 0 0 1 -4.681 1.327c-3.6 0 -6.6 -2 -9 -6c1.272 -2.12 2.712 -3.678 4.32 -4.674m2.86 -1.146a9.055 9.055 0 0 1 1.82 -.18c3.6 0 6.6 2 9 6c-.666 1.11 -1.379 2.067 -2.138 2.87" />
        <path d="M3 3l18 18" />
      </svg>,
    'caret-left': <svg xmlns="http://www.w3.org/2000/svg" width={size} height={size} viewBox="0 0 24 24" fill="none" stroke="currentColor" strokeWidth="2" strokeLinecap="round" strokeLinejoin="round">
        <path stroke="none" d="M0 0h24v24H0z" fill="none" />
        <path d="M14 6l-6 6l6 6v-12" />
      </svg>,
    'caret-right': <svg xmlns="http://www.w3.org/2000/svg" width={size} height={size} viewBox="0 0 24 24" fill="none" stroke="currentColor" strokeWidth="2" strokeLinecap="round" strokeLinejoin="round">
        <path stroke="none" d="M0 0h24v24H0z" fill="none" />
        <path d="M10 18l6 -6l-6 -6v12" />
      </svg>,
    'number-123': <svg xmlns="http://www.w3.org/2000/svg" width={size} height={size} viewBox="0 0 24 24" fill="none" stroke="currentColor" strokeWidth="2" strokeLinecap="round" strokeLinejoin="round">
        <path stroke="none" d="M0 0h24v24H0z" fill="none" />
        <path d="M3 10l2 -2v8" />
        <path d="M9 8h3a1 1 0 0 1 1 1v2a1 1 0 0 1 -1 1h-2a1 1 0 0 0 -1 1v2a1 1 0 0 0 1 1h3" />
        <path d="M17 8h2.5a1.5 1.5 0 0 1 1.5 1.5v1a1.5 1.5 0 0 1 -1.5 1.5h-1.5h1.5a1.5 1.5 0 0 1 1.5 1.5v1a1.5 1.5 0 0 1 -1.5 1.5h-2.5" />
      </svg>,
    'frame': <svg xmlns="http://www.w3.org/2000/svg" width={size} height={size} viewBox="0 0 24 24" fill="none" stroke="currentColor" strokeWidth="2" strokeLinecap="round" strokeLinejoin="round">
        <path stroke="none" d="M0 0h24v24H0z" fill="none" />
        <path d="M4 7l16 0" />
        <path d="M4 17l16 0" />
        <path d="M7 4l0 16" />
        <path d="M17 4l0 16" />
      </svg>,
    'align-box-left-top': <svg xmlns="http://www.w3.org/2000/svg" width={size} height={size} viewBox="0 0 24 24" fill="none" stroke="currentColor" strokeWidth="2" strokeLinecap="round" strokeLinejoin="round">
        <path stroke="none" d="M0 0h24v24H0z" fill="none" />
        <path d="M3 5a2 2 0 0 1 2 -2h14a2 2 0 0 1 2 2v14a2 2 0 0 1 -2 2h-14a2 2 0 0 1 -2 -2v-14" />
        <path d="M9 13h-2" />
        <path d="M13 10h-6" />
        <path d="M11 7h-4" />
      </svg>
  };
  const selectedIcon = icons[icon];
  if (!selectedIcon) {
    return null;
  }
  return selectedIcon;
};

## Widgeturi disponibile

Twenty oferă diverse tipuri de widgeturi pentru a vă vizualiza datele CRM.

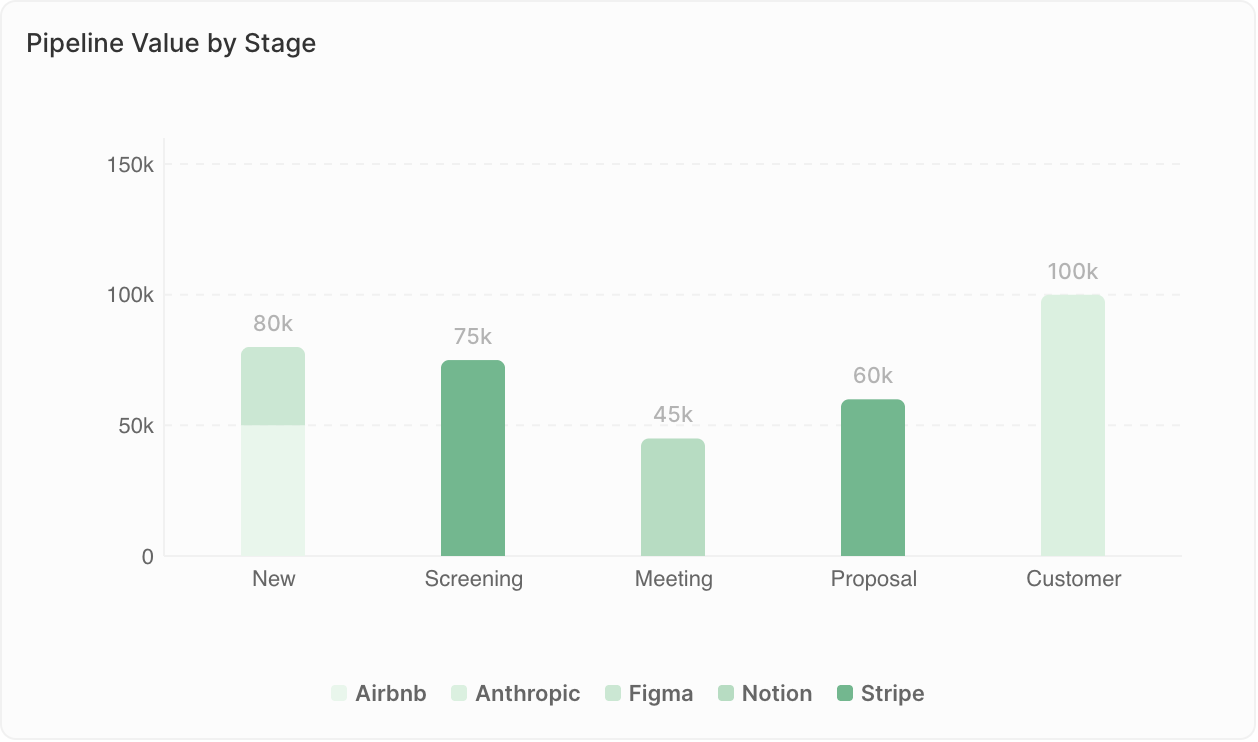
### <span style={{ display: 'inline-flex', alignItems: 'center', gap: '8px' }}><ChartIcon icon="chart-bar-popular" />Grafice cu bare</span>

Afișează datele sub formă de bare orizontale sau verticale.

<Frame>
  <img src="https://mintcdn.com/twenty/rtjyQTAh0DrLn5Sz/images/user-guide/dashboard/dashboard-widget-bar-chart.png?fit=max&auto=format&n=rtjyQTAh0DrLn5Sz&q=85&s=81765220d7d28faa18aedffa5e669174" alt="Grafic cu bare" width="1258" height="742" data-path="images/user-guide/dashboard/dashboard-widget-bar-chart.png" />
</Frame>

**Cel mai potrivit pentru:**

* Compararea valorilor între categorii
* Afișarea clasamentelor
* Urmărirea indicatorilor pe perioade de timp

**Exemple de utilizare:**

* Oportunități după stadiu
* Venituri după reprezentant de vânzări
* Contacte adăugate pe lună

<Note>
  **Limite de afișare**: Graficele cu bare pot afișa maximum 100 de bare și 50 de grupuri pentru fiecare bară când se utilizează Group By. Dacă vedeți avertismentul "Date neafișate: max X bare pe grafic", adăugați filtre pentru a restrânge datele sau schimbați gruparea (de ex., grupați pe săptămână în loc de zile).
</Note>

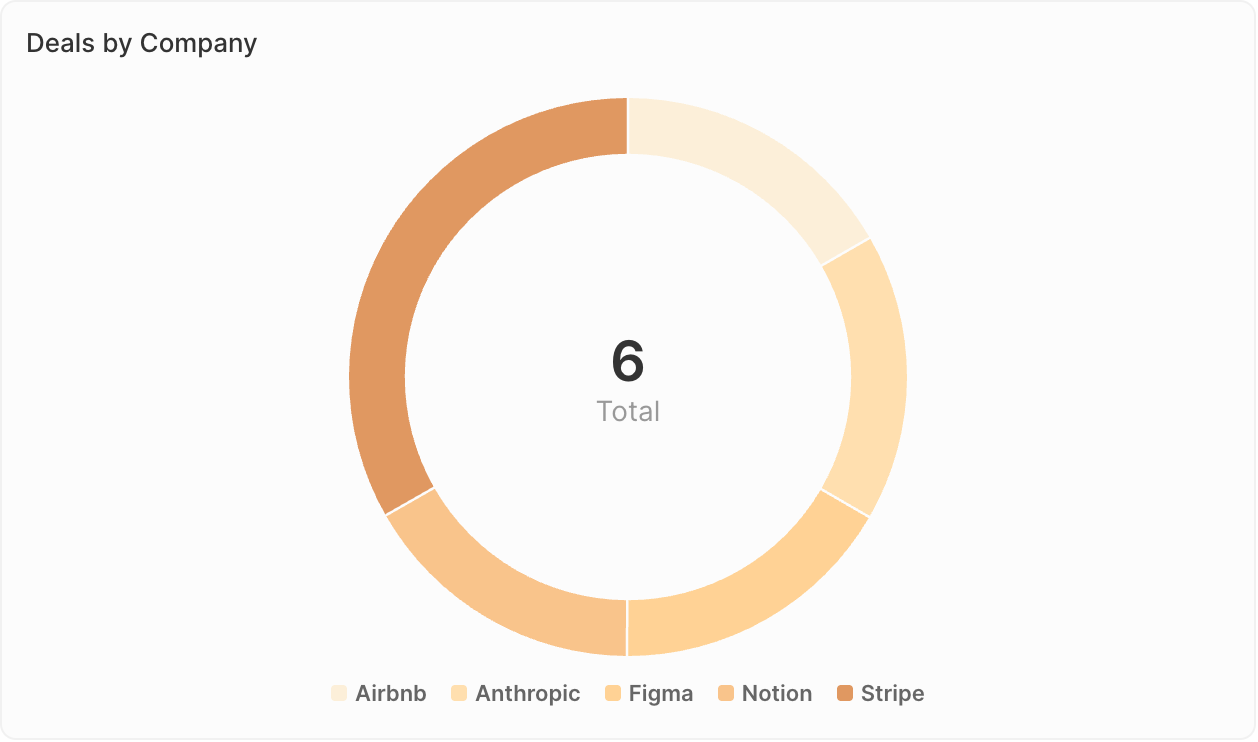
### <span style={{ display: 'inline-flex', alignItems: 'center', gap: '8px' }}><ChartIcon icon="chart-pie" />Grafice circulare</span>

Afișează proporțiile dintr-un întreg.

<Frame>
  <img src="https://mintcdn.com/twenty/rtjyQTAh0DrLn5Sz/images/user-guide/dashboard/dashboard-widget-pie-chart.png?fit=max&auto=format&n=rtjyQTAh0DrLn5Sz&q=85&s=b3172f5c7a5f1f40a6e5e463f0172446" alt="Grafic circular" width="1258" height="742" data-path="images/user-guide/dashboard/dashboard-widget-pie-chart.png" />
</Frame>

**Cel mai potrivit pentru:**

* Afișarea compoziției sau distribuției
* Compararea părților cu întregul
* Evidențierea segmentelor principale

**Exemple de utilizare:**

* Distribuția oportunităților după sursă
* Defalcarea contactelor după industrie
* Compoziția pipeline-ului după proprietar

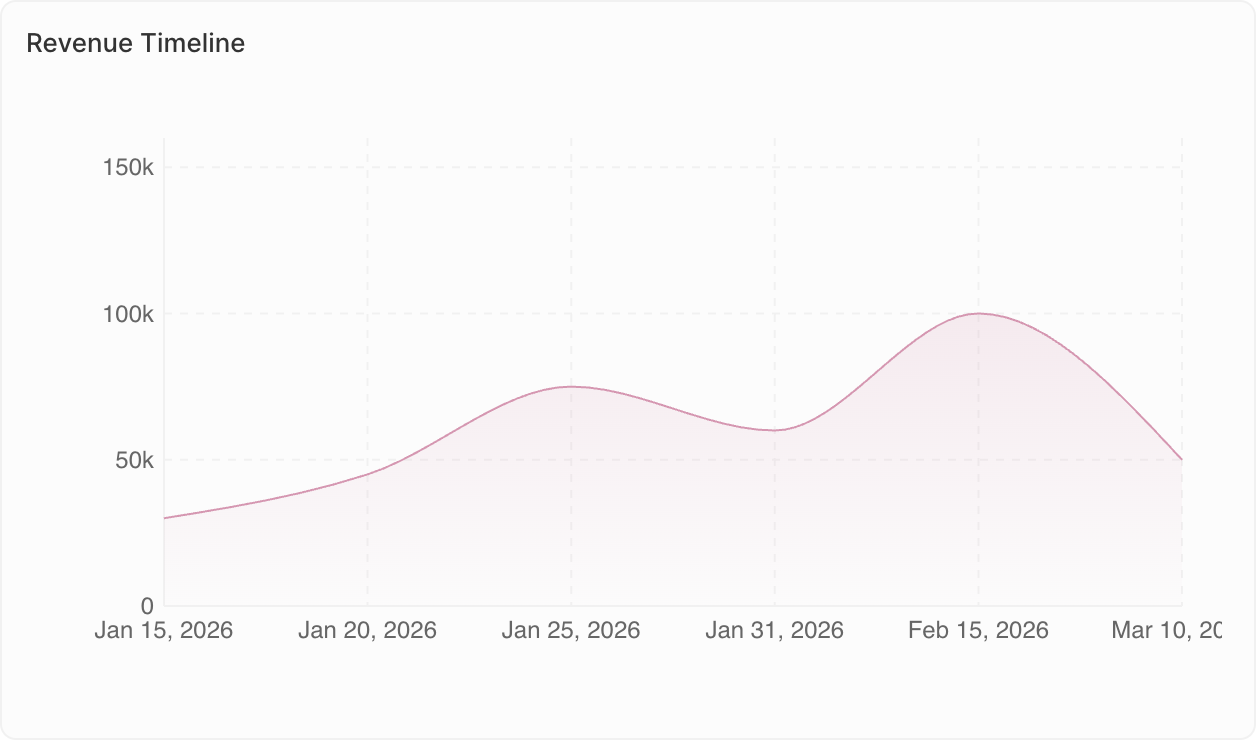
### <span style={{ display: 'inline-flex', alignItems: 'center', gap: '8px' }}><ChartIcon icon="chart-line" />Grafice liniare</span>

Afișează tendințele în timp.

<Frame>
  <img src="https://mintcdn.com/twenty/rtjyQTAh0DrLn5Sz/images/user-guide/dashboard/dashboard-widget-line-chart.png?fit=max&auto=format&n=rtjyQTAh0DrLn5Sz&q=85&s=6ec6177e1f779cac4dfb4c42fc4de0fc" alt="Grafic liniar" width="1258" height="742" data-path="images/user-guide/dashboard/dashboard-widget-line-chart.png" />
</Frame>

**Cel mai potrivit pentru:**

* Urmărirea schimbărilor în timp
* Identificarea tendințelor
* Compararea mai multor indicatori

**Exemple de utilizare:**

* Tendința lunară a numărului de oportunități
* Creșterea veniturilor pe trimestre
* Nivelurile de activitate în timp

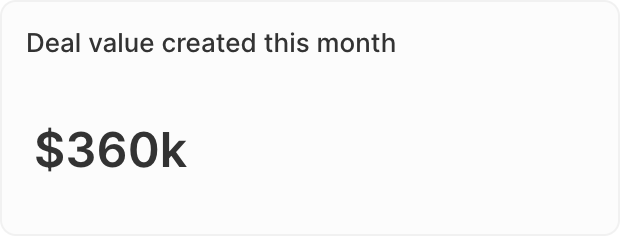
### <span style={{ display: 'inline-flex', alignItems: 'center', gap: '8px' }}><ChartIcon icon="sum" />Diagrame agregate</span>

Afișează proeminent valori cheie unice.

<Frame>
  <img src="https://mintcdn.com/twenty/rtjyQTAh0DrLn5Sz/images/user-guide/dashboard/dashboard-widget-aggregate-chart.png?fit=max&auto=format&n=rtjyQTAh0DrLn5Sz&q=85&s=ce43dedfdcfc4512b7c616c7a78df75a" alt="Diagramă agregată" width="622" height="236" data-path="images/user-guide/dashboard/dashboard-widget-aggregate-chart.png" />
</Frame>

**Cel mai potrivit pentru:**

* Evidențierea indicatorilor cheie de performanță (KPI)
* Afișarea totalurilor sau mediilor
* Verificări rapide ale stării

**Exemple de utilizare:**

* Valoarea totală a pipeline-ului
* Numărul de oportunități deschise
* Rată de conversie

**Opțiuni avansate:**

* **Ratio**: Pentru câmpurile Select, calculați rapoarte între valori. Accesați **Data on display** → selectați câmpul → activați opțiunea **Ratio**.
* **Prefix și Sufix**: Adăugați text personalizat înainte sau după număr (de ex., prefix "\$" sau sufix "%") pentru o lizibilitate mai bună.

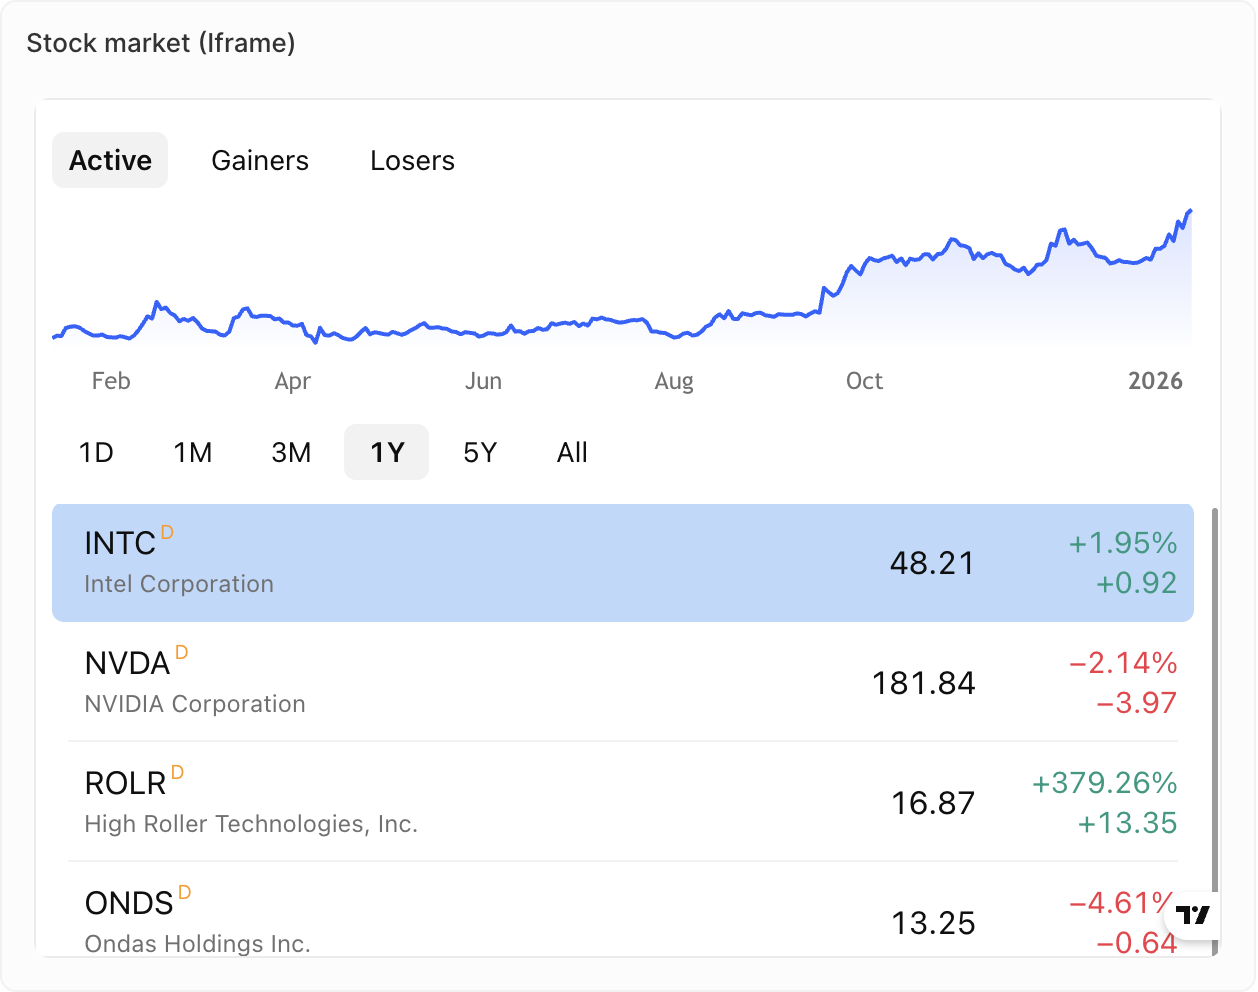
### <span style={{ display: 'inline-flex', alignItems: 'center', gap: '8px' }}><ChartIcon icon="frame" />iFrame-uri</span>

Încorporați instrumente externe și conținut extern direct în tabloul de bord.

<Frame>
  <img src="https://mintcdn.com/twenty/rtjyQTAh0DrLn5Sz/images/user-guide/dashboard/dashboard-widget-iframe.png?fit=max&auto=format&n=rtjyQTAh0DrLn5Sz&q=85&s=52cba90e5d56ce805c1d6cdd17c8f2a8" alt="iFrame" width="1258" height="992" data-path="images/user-guide/dashboard/dashboard-widget-iframe.png" />
</Frame>

**Cel mai potrivit pentru:**

* Afișarea rapoartelor sau tablourilor de bord externe
* Integrarea instrumentelor de vânzări terțe
* Afișarea conținutului în timp real din alte sisteme

**Exemple de utilizare:**

* Indicatori din instrumentul de asistență
* Indicatori din dialer
* Conținut în timp real din instrumentul de secvențe de vânzări

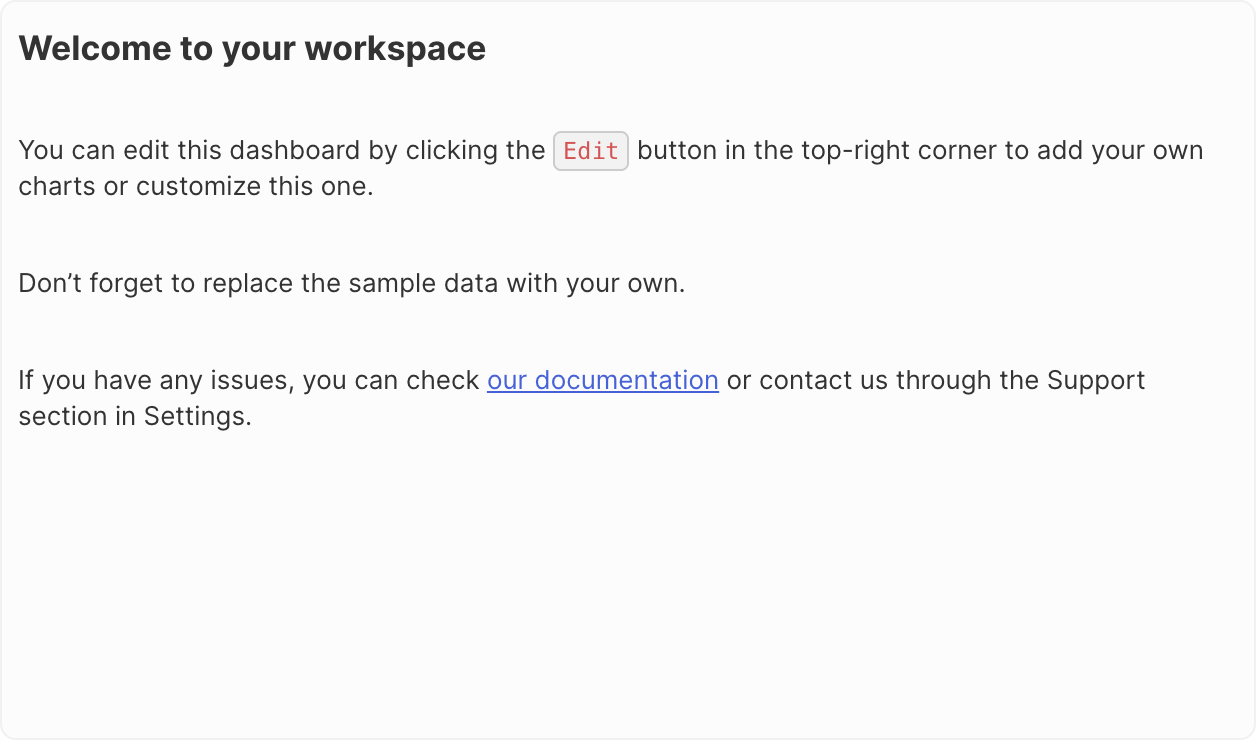
### <span style={{ display: 'inline-flex', alignItems: 'center', gap: '8px' }}><ChartIcon icon="align-box-left-top" />Text îmbogățit</span>

Adăugați text formatat și conținut direct în tabloul de bord.

<Frame>
  <img src="https://mintcdn.com/twenty/rtjyQTAh0DrLn5Sz/images/user-guide/dashboard/dashboard-widget-rich-text.png?fit=max&auto=format&n=rtjyQTAh0DrLn5Sz&q=85&s=e006d6b5fe8c362b66a43b1a03096a5a" alt="Text îmbogățit" width="1258" height="742" data-path="images/user-guide/dashboard/dashboard-widget-rich-text.png" />
</Frame>

**Cel mai potrivit pentru:**

* Adăugarea de context sau instrucțiuni
* Descrieri ale tabloului de bord
* Note și adnotări

**Funcționalități:**

* Formatare de tip text îmbogățit (aldin, cursiv, liste etc.)
* Încărcarea imaginilor și fișierelor
* Editare în stil Markdown

<Note>
  **În curând**: Graficele tip indicator (gauge) și tabelele nu sunt încă disponibile, dar se află pe foaia noastră de parcurs.
</Note>

### Duplicarea widgeturilor

1. Faceți clic pe widget
2. Deschideți **Opțiuni**
3. Faceți clic pe **Duplicare widget**