> ## Documentation Index
> Fetch the complete documentation index at: https://docs.twenty.com/llms.txt
> Use this file to discover all available pages before exploring further.

# Chart Settings

> Configure your charts to display data exactly how you need it.

export const ChartIcon = ({icon, size = 20}) => {
  const icons = {
    'database': <svg xmlns="http://www.w3.org/2000/svg" width={size} height={size} viewBox="0 0 24 24" fill="none" stroke="currentColor" strokeWidth="2" strokeLinecap="round" strokeLinejoin="round">
        <path stroke="none" d="M0 0h24v24H0z" fill="none" />
        <path d="M4 6a8 3 0 1 0 16 0a8 3 0 1 0 -16 0" />
        <path d="M4 6v6a8 3 0 0 0 16 0v-6" />
        <path d="M4 12v6a8 3 0 0 0 16 0v-6" />
      </svg>,
    'filter': <svg xmlns="http://www.w3.org/2000/svg" width={size} height={size} viewBox="0 0 24 24" fill="none" stroke="currentColor" strokeWidth="2" strokeLinecap="round" strokeLinejoin="round">
        <path stroke="none" d="M0 0h24v24H0z" fill="none" />
        <path d="M4 4h16v2.172a2 2 0 0 1 -.586 1.414l-4.414 4.414v7l-6 2v-8.5l-4.48 -4.928a2 2 0 0 1 -.52 -1.345v-2.227" />
      </svg>,
    'axis-x': <svg xmlns="http://www.w3.org/2000/svg" width={size} height={size} viewBox="0 0 24 24" fill="none" stroke="currentColor" strokeWidth="2" strokeLinecap="round" strokeLinejoin="round">
        <path stroke="none" d="M0 0h24v24H0z" fill="none" />
        <path d="M4 13v.01" />
        <path d="M4 9v.01" />
        <path d="M4 5v.01" />
        <path d="M17 20l3 -3l-3 -3" />
        <path d="M4 17h16" />
      </svg>,
    'axis-y': <svg xmlns="http://www.w3.org/2000/svg" width={size} height={size} viewBox="0 0 24 24" fill="none" stroke="currentColor" strokeWidth="2" strokeLinecap="round" strokeLinejoin="round">
        <path stroke="none" d="M0 0h24v24H0z" fill="none" />
        <path d="M11 20h-.01" />
        <path d="M15 20h-.01" />
        <path d="M19 20h-.01" />
        <path d="M4 7l3 -3l3 3" />
        <path d="M7 20v-16" />
      </svg>,
    'sum': <svg xmlns="http://www.w3.org/2000/svg" width={size} height={size} viewBox="0 0 24 24" fill="none" stroke="currentColor" strokeWidth="2" strokeLinecap="round" strokeLinejoin="round">
        <path stroke="none" d="M0 0h24v24H0z" fill="none" />
        <path d="M18 16v2a1 1 0 0 1 -1 1h-11l6 -7l-6 -7h11a1 1 0 0 1 1 1v2" />
      </svg>,
    'chart-pie': <svg xmlns="http://www.w3.org/2000/svg" width={size} height={size} viewBox="0 0 24 24" fill="none" stroke="currentColor" strokeWidth="2" strokeLinecap="round" strokeLinejoin="round">
        <path stroke="none" d="M0 0h24v24H0z" fill="none" />
        <path d="M10 3.2a9 9 0 1 0 10.8 10.8a1 1 0 0 0 -1 -1h-6.8a2 2 0 0 1 -2 -2v-7a.9 .9 0 0 0 -1 -.8" />
        <path d="M15 3.5a9 9 0 0 1 5.5 5.5h-4.5a1 1 0 0 1 -1 -1v-4.5" />
      </svg>,
    'chart-line': <svg xmlns="http://www.w3.org/2000/svg" width={size} height={size} viewBox="0 0 24 24" fill="none" stroke="currentColor" strokeWidth="2" strokeLinecap="round" strokeLinejoin="round">
        <path stroke="none" d="M0 0h24v24H0z" fill="none" />
        <path d="M4 19l16 0" />
        <path d="M4 15l4 -6l4 2l4 -5l4 4" />
      </svg>,
    'calendar': <svg xmlns="http://www.w3.org/2000/svg" width={size} height={size} viewBox="0 0 24 24" fill="none" stroke="currentColor" strokeWidth="2" strokeLinecap="round" strokeLinejoin="round">
        <path stroke="none" d="M0 0h24v24H0z" fill="none" />
        <path d="M4 7a2 2 0 0 1 2 -2h12a2 2 0 0 1 2 2v12a2 2 0 0 1 -2 2h-12a2 2 0 0 1 -2 -2v-12" />
        <path d="M16 3v4" />
        <path d="M8 3v4" />
        <path d="M4 11h16" />
        <path d="M11 15h1" />
        <path d="M12 15v3" />
      </svg>,
    'arrows-sort': <svg xmlns="http://www.w3.org/2000/svg" width={size} height={size} viewBox="0 0 24 24" fill="none" stroke="currentColor" strokeWidth="2" strokeLinecap="round" strokeLinejoin="round">
        <path stroke="none" d="M0 0h24v24H0z" fill="none" />
        <path d="M3 9l4 -4l4 4m-4 -4v14" />
        <path d="M21 15l-4 4l-4 -4m4 4v-14" />
      </svg>,
    'filters': <svg xmlns="http://www.w3.org/2000/svg" width={size} height={size} viewBox="0 0 24 24" fill="none" stroke="currentColor" strokeWidth="2" strokeLinecap="round" strokeLinejoin="round">
        <path stroke="none" d="M0 0h24v24H0z" fill="none" />
        <path d="M7 8a5 5 0 1 0 10 0a5 5 0 1 0 -10 0" />
        <path d="M8 11a5 5 0 1 0 3.998 1.997" />
        <path d="M12.002 19.003a5 5 0 1 0 3.998 -8.003" />
      </svg>,
    'chart-bar-popular': <svg xmlns="http://www.w3.org/2000/svg" width={size} height={size} viewBox="0 0 24 24" fill="none" stroke="currentColor" strokeWidth="2" strokeLinecap="round" strokeLinejoin="round">
        <path stroke="none" d="M0 0h24v24H0z" fill="none" />
        <path d="M3 13a1 1 0 0 1 1 -1h4a1 1 0 0 1 1 1v6a1 1 0 0 1 -1 1h-4a1 1 0 0 1 -1 -1l0 -6" />
        <path d="M9 9a1 1 0 0 1 1 -1h4a1 1 0 0 1 1 1v10a1 1 0 0 1 -1 1h-4a1 1 0 0 1 -1 -1l0 -10" />
        <path d="M15 5a1 1 0 0 1 1 -1h4a1 1 0 0 1 1 1v14a1 1 0 0 1 -1 1h-4a1 1 0 0 1 -1 -1l0 -14" />
        <path d="M4 20h14" />
      </svg>,
    'math-min': <svg xmlns="http://www.w3.org/2000/svg" width={size} height={size} viewBox="0 0 24 24" fill="none" stroke="currentColor" strokeWidth="2" strokeLinecap="round" strokeLinejoin="round">
        <path stroke="none" d="M0 0h24v24H0z" fill="none" />
        <path d="M15 18a2 2 0 1 0 4 0a2 2 0 0 0 -4 0" />
        <path d="M3 13s1 -9 4 -9c2.48 0 5.643 9.565 8.36 12.883" />
        <path d="M18.748 17.038c.702 -.88 1.452 -3.56 2.252 -8.038" />
      </svg>,
    'math-max': <svg xmlns="http://www.w3.org/2000/svg" width={size} height={size} viewBox="0 0 24 24" fill="none" stroke="currentColor" strokeWidth="2" strokeLinecap="round" strokeLinejoin="round">
        <path stroke="none" d="M0 0h24v24H0z" fill="none" />
        <path d="M5 6a2 2 0 1 0 4 0a2 2 0 0 0 -4 0" />
        <path d="M3 15s.616 -5.544 2.332 -7.93" />
        <path d="M8.637 7.112c2.717 3.313 5.882 12.888 8.363 12.888c2 0 3.333 -3 4 -9" />
      </svg>,
    'color-swatch': <svg xmlns="http://www.w3.org/2000/svg" width={size} height={size} viewBox="0 0 24 24" fill="none" stroke="currentColor" strokeWidth="2" strokeLinecap="round" strokeLinejoin="round">
        <path stroke="none" d="M0 0h24v24H0z" fill="none" />
        <path d="M19 3h-4a2 2 0 0 0 -2 2v12a4 4 0 0 0 8 0v-12a2 2 0 0 0 -2 -2" />
        <path d="M13 7.35l-2 -2a2 2 0 0 0 -2.828 0l-2.828 2.828a2 2 0 0 0 0 2.828l9 9" />
        <path d="M7.3 13h-2.3a2 2 0 0 0 -2 2v4a2 2 0 0 0 2 2h12" />
        <path d="M17 17l0 .01" />
      </svg>,
    'gizmo': <svg xmlns="http://www.w3.org/2000/svg" width={size} height={size} viewBox="0 0 24 24" fill="none" stroke="currentColor" strokeWidth="2" strokeLinecap="round" strokeLinejoin="round">
        <path stroke="none" d="M0 0h24v24H0z" fill="none" />
        <path d="M20 19l-8 -5.5l-8 5.5" />
        <path d="M12 4v9.5" />
        <path d="M11 4a1 1 0 1 0 2 0a1 1 0 1 0 -2 0" />
        <path d="M3 19a1 1 0 1 0 2 0a1 1 0 1 0 -2 0" />
        <path d="M19 19a1 1 0 1 0 2 0a1 1 0 1 0 -2 0" />
      </svg>,
    'stack-2': <svg xmlns="http://www.w3.org/2000/svg" width={size} height={size} viewBox="0 0 24 24" fill="none" stroke="currentColor" strokeWidth="2" strokeLinecap="round" strokeLinejoin="round">
        <path stroke="none" d="M0 0h24v24H0z" fill="none" />
        <path d="M12 4l-8 4l8 4l8 -4l-8 -4" />
        <path d="M4 12l8 4l8 -4" />
        <path d="M4 16l8 4l8 -4" />
      </svg>,
    'badge-2k': <svg xmlns="http://www.w3.org/2000/svg" width={size} height={size} viewBox="0 0 24 24" fill="none" stroke="currentColor" strokeWidth="2" strokeLinecap="round" strokeLinejoin="round">
        <path stroke="none" d="M0 0h24v24H0z" fill="none" />
        <path d="M3 7a2 2 0 0 1 2 -2h14a2 2 0 0 1 2 2v10a2 2 0 0 1 -2 2h-14a2 2 0 0 1 -2 -2l0 -10" />
        <path d="M14 9v6" />
        <path d="M17 9l-2 3l2 3" />
        <path d="M15 12h-1" />
        <path d="M7 9h2a1 1 0 0 1 1 1v1a1 1 0 0 1 -1 1h-1a1 1 0 0 0 -1 1v1a1 1 0 0 0 1 1h2" />
      </svg>,
    'text-caption': <svg xmlns="http://www.w3.org/2000/svg" width={size} height={size} viewBox="0 0 24 24" fill="none" stroke="currentColor" strokeWidth="2" strokeLinecap="round" strokeLinejoin="round">
        <path stroke="none" d="M0 0h24v24H0z" fill="none" />
        <path d="M4 15h16" />
        <path d="M4 5a1 1 0 0 1 1 -1h4a1 1 0 0 1 1 1v4a1 1 0 0 1 -1 1h-4a1 1 0 0 1 -1 -1l0 -4" />
        <path d="M4 20h12" />
      </svg>,
    'eye-off': <svg xmlns="http://www.w3.org/2000/svg" width={size} height={size} viewBox="0 0 24 24" fill="none" stroke="currentColor" strokeWidth="2" strokeLinecap="round" strokeLinejoin="round">
        <path stroke="none" d="M0 0h24v24H0z" fill="none" />
        <path d="M10.585 10.587a2 2 0 0 0 2.829 2.828" />
        <path d="M16.681 16.673a8.717 8.717 0 0 1 -4.681 1.327c-3.6 0 -6.6 -2 -9 -6c1.272 -2.12 2.712 -3.678 4.32 -4.674m2.86 -1.146a9.055 9.055 0 0 1 1.82 -.18c3.6 0 6.6 2 9 6c-.666 1.11 -1.379 2.067 -2.138 2.87" />
        <path d="M3 3l18 18" />
      </svg>,
    'caret-left': <svg xmlns="http://www.w3.org/2000/svg" width={size} height={size} viewBox="0 0 24 24" fill="none" stroke="currentColor" strokeWidth="2" strokeLinecap="round" strokeLinejoin="round">
        <path stroke="none" d="M0 0h24v24H0z" fill="none" />
        <path d="M14 6l-6 6l6 6v-12" />
      </svg>,
    'caret-right': <svg xmlns="http://www.w3.org/2000/svg" width={size} height={size} viewBox="0 0 24 24" fill="none" stroke="currentColor" strokeWidth="2" strokeLinecap="round" strokeLinejoin="round">
        <path stroke="none" d="M0 0h24v24H0z" fill="none" />
        <path d="M10 18l6 -6l-6 -6v12" />
      </svg>,
    'number-123': <svg xmlns="http://www.w3.org/2000/svg" width={size} height={size} viewBox="0 0 24 24" fill="none" stroke="currentColor" strokeWidth="2" strokeLinecap="round" strokeLinejoin="round">
        <path stroke="none" d="M0 0h24v24H0z" fill="none" />
        <path d="M3 10l2 -2v8" />
        <path d="M9 8h3a1 1 0 0 1 1 1v2a1 1 0 0 1 -1 1h-2a1 1 0 0 0 -1 1v2a1 1 0 0 0 1 1h3" />
        <path d="M17 8h2.5a1.5 1.5 0 0 1 1.5 1.5v1a1.5 1.5 0 0 1 -1.5 1.5h-1.5h1.5a1.5 1.5 0 0 1 1.5 1.5v1a1.5 1.5 0 0 1 -1.5 1.5h-2.5" />
      </svg>,
    'frame': <svg xmlns="http://www.w3.org/2000/svg" width={size} height={size} viewBox="0 0 24 24" fill="none" stroke="currentColor" strokeWidth="2" strokeLinecap="round" strokeLinejoin="round">
        <path stroke="none" d="M0 0h24v24H0z" fill="none" />
        <path d="M4 7l16 0" />
        <path d="M4 17l16 0" />
        <path d="M7 4l0 16" />
        <path d="M17 4l0 16" />
      </svg>,
    'align-box-left-top': <svg xmlns="http://www.w3.org/2000/svg" width={size} height={size} viewBox="0 0 24 24" fill="none" stroke="currentColor" strokeWidth="2" strokeLinecap="round" strokeLinejoin="round">
        <path stroke="none" d="M0 0h24v24H0z" fill="none" />
        <path d="M3 5a2 2 0 0 1 2 -2h14a2 2 0 0 1 2 2v14a2 2 0 0 1 -2 2h-14a2 2 0 0 1 -2 -2v-14" />
        <path d="M9 13h-2" />
        <path d="M13 10h-6" />
        <path d="M11 7h-4" />
      </svg>
  };
  const selectedIcon = icons[icon];
  if (!selectedIcon) {
    return null;
  }
  return selectedIcon;
};

## Accessing Chart Settings

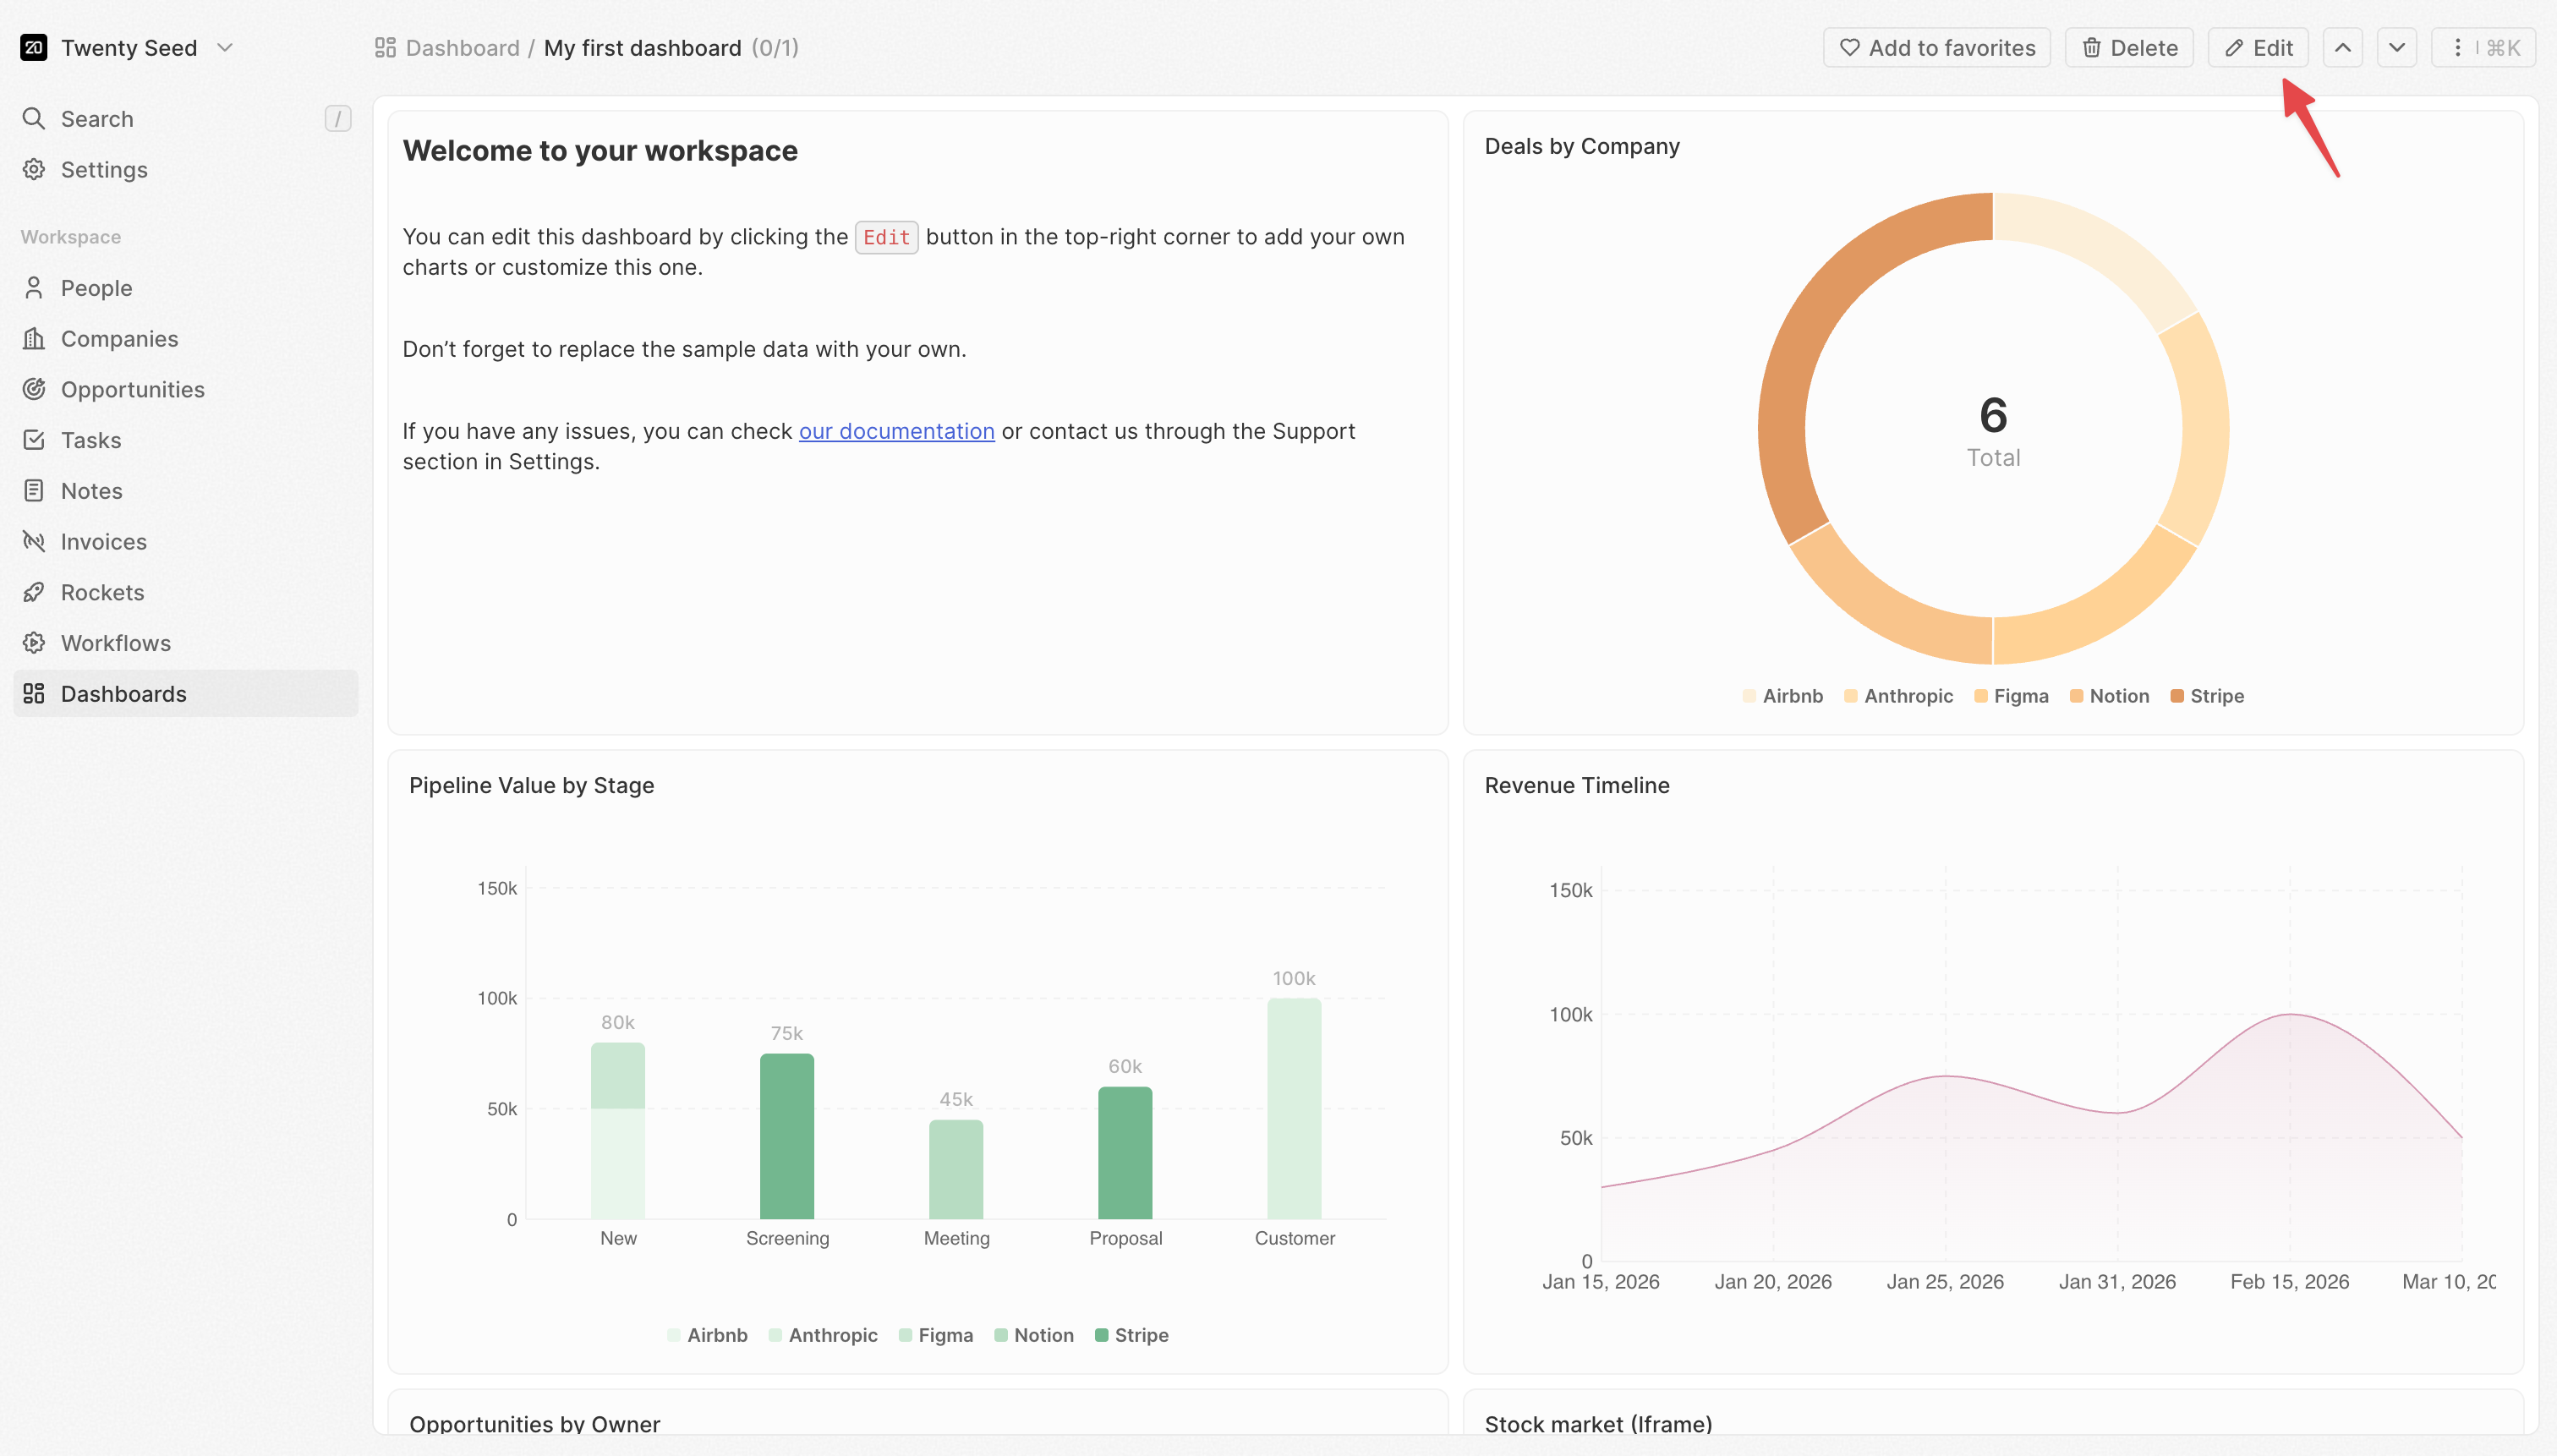
1. Click the **Edit** button in the top-right corner of your dashboard

<img src="https://mintcdn.com/twenty/rtjyQTAh0DrLn5Sz/images/user-guide/dashboard/dashboard-edit.png?fit=max&auto=format&n=rtjyQTAh0DrLn5Sz&q=85&s=7e7c29f7cd1e15da39bbce586db5fc00" alt="Edit mode" width="3024" height="1722" data-path="images/user-guide/dashboard/dashboard-edit.png" />

2. The dashboard enters edit mode
3. Click on any widget to select it
4. The settings panel opens on the right

Settings are organized into sections:

* **Data**: What data to pull and how to filter it
* **X axis**: How to group and sort categories (bar/line charts)
* **Y axis**: What to measure and how to display it (bar/line charts)
* **Style**: Colors, labels, and visual options

<Note>
  Some settings only appear when other settings are configured. For example, **Date granularity** only appears when you select a date field.
</Note>

***

## Data Settings

### <span style={{ display: 'inline-flex', alignItems: 'center', gap: '8px' }}> <ChartIcon icon="database" />Source </span>

Choose which object to pull data from.

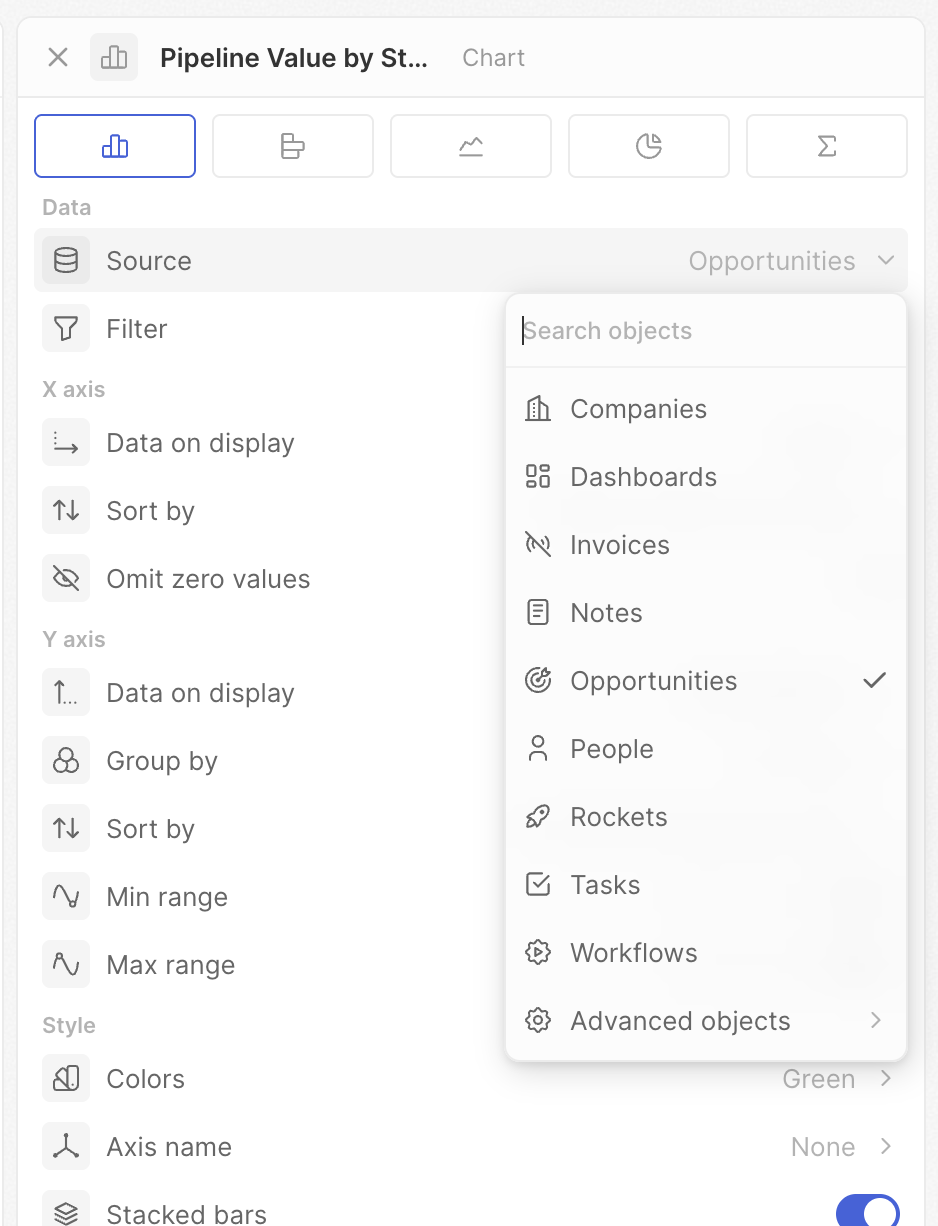
1. Click **Source**
2. Select an object (Opportunities, People, Companies, etc.)

All your standard and custom objects are available. Changing the source resets other settings since field options depend on the selected object.

<img src="https://mintcdn.com/twenty/rtjyQTAh0DrLn5Sz/images/user-guide/dashboard/dashboard-chart-settings-source.png?fit=max&auto=format&n=rtjyQTAh0DrLn5Sz&q=85&s=35db0497e477be353b26da56b595f45e" alt="Source" width="938" height="1226" data-path="images/user-guide/dashboard/dashboard-chart-settings-source.png" />

### <span style={{ display: 'inline-flex', alignItems: 'center', gap: '8px' }}> <ChartIcon icon="filter" />Filter </span>

Limit which records are included in the chart.

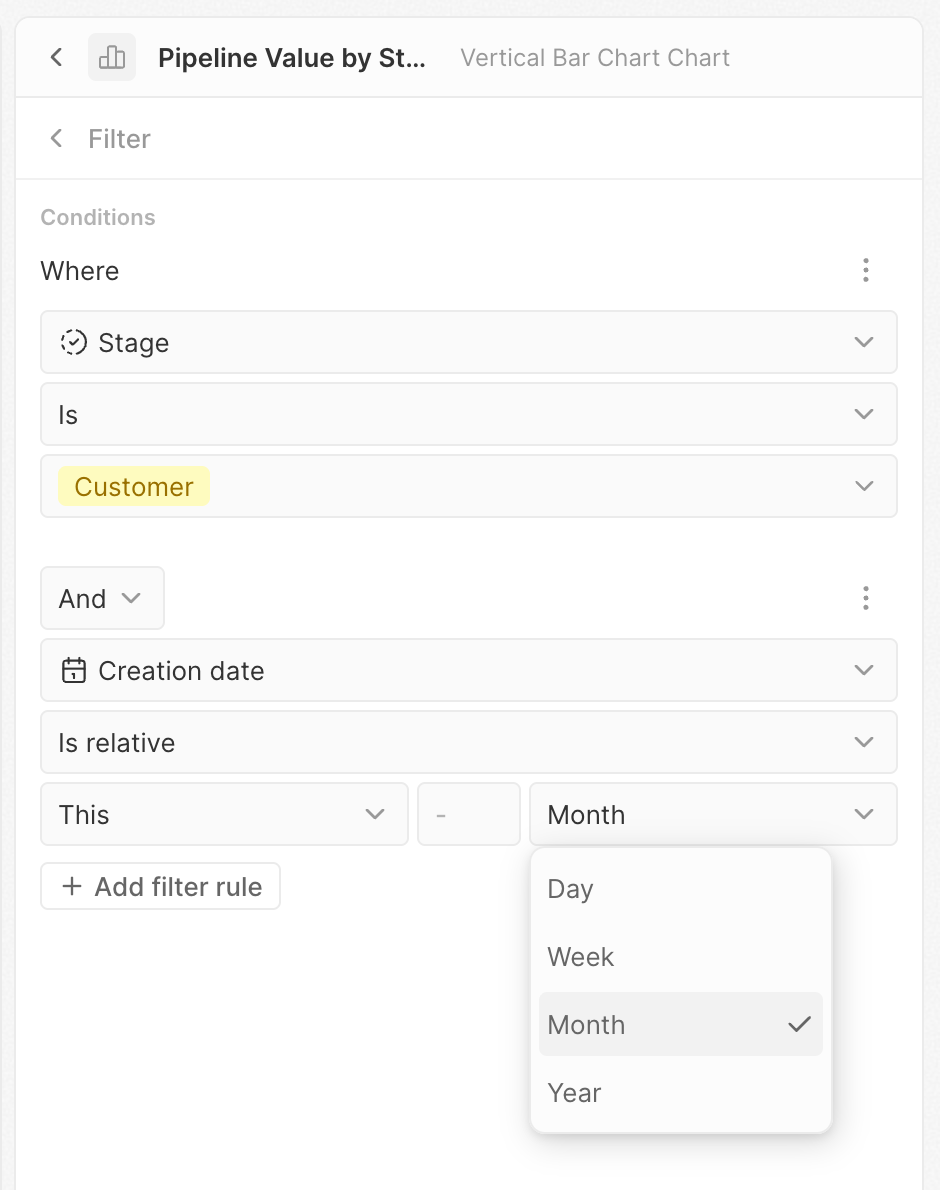
1. Click **Filter**
2. The filter builder opens
3. Click **+ Add filter**
4. Select a field, condition, and value
5. Add more filters as needed

Filters work the same as in table views. Use them to focus on specific segments of your data.

**Example**: Filter opportunities where Stage equals "Won" to show only closed deals.

<img src="https://mintcdn.com/twenty/rtjyQTAh0DrLn5Sz/images/user-guide/dashboard/dashboard-chart-settings-filters.png?fit=max&auto=format&n=rtjyQTAh0DrLn5Sz&q=85&s=3b8505dba7d329779cb2163e23771422" alt="Filter" width="940" height="1190" data-path="images/user-guide/dashboard/dashboard-chart-settings-filters.png" />

<Tip>
  For date fields, try **Is relative** to create dynamic filters like "Past 7 days" or "This month" that automatically update.
</Tip>

<Tip>
  Advanced filters are supported—add multiple filter rules and combine them with **And** or **Or** logic.
</Tip>

***

## X Axis Settings

These settings control the horizontal axis of bar and line charts—typically how your data is grouped into categories.

### <span style={{ display: 'inline-flex', alignItems: 'center', gap: '8px' }}> <ChartIcon icon="axis-x" />Data on display </span>

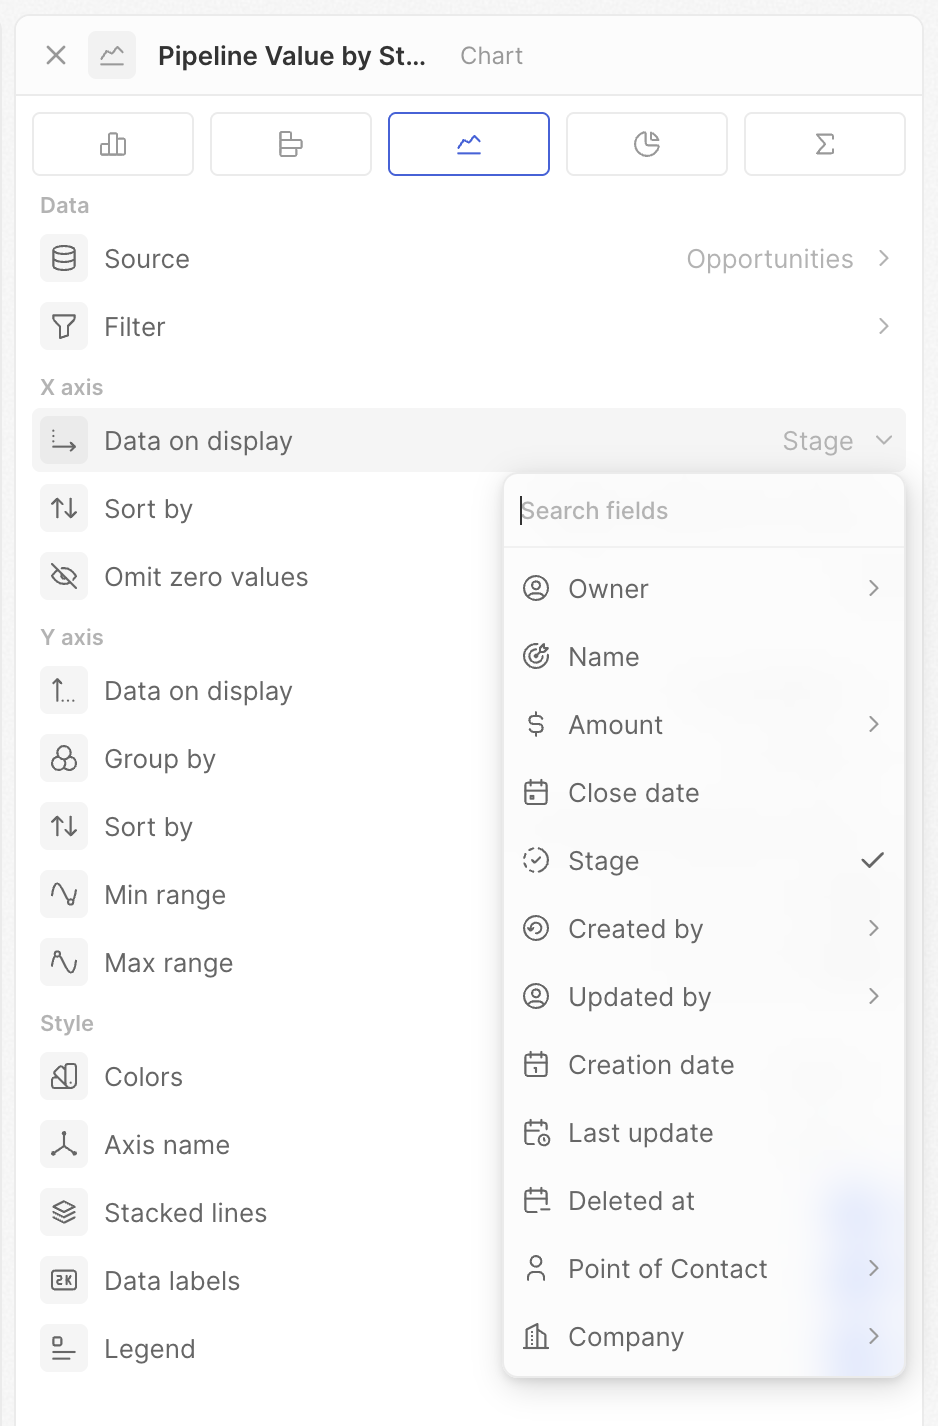
Select the field to group your data by. This determines the categories shown on the X axis.

**Example**: Select "Stage" to see data grouped by pipeline stage, or "Created date" to see data over time.

<img src="https://mintcdn.com/twenty/rtjyQTAh0DrLn5Sz/images/user-guide/dashboard/dashboard-chart-settings-x-data-on-display.png?fit=max&auto=format&n=rtjyQTAh0DrLn5Sz&q=85&s=5f3b48779f7f70a67416e9dd84b0a416" alt="Data on display" width="938" height="1426" data-path="images/user-guide/dashboard/dashboard-chart-settings-x-data-on-display.png" />

### <span style={{ display: 'inline-flex', alignItems: 'center', gap: '8px' }}> <ChartIcon icon="calendar" />Date granularity </span>

When grouping by a date field, choose the time period for grouping.

| Option              | Groups data by       | Example output                                |
| ------------------- | -------------------- | --------------------------------------------- |
| **Day**             | Each calendar day    | Jan 1, Jan 2, Jan 3...                        |
| **Week**            | Calendar weeks       | Week 1, Week 2, Week 3...                     |
| **Month**           | Calendar months      | January, February, March...                   |
| **Quarter**         | Fiscal quarters      | Q1, Q2, Q3, Q4                                |
| **Year**            | Calendar years       | 2023, 2024, 2025                              |
| **Day of week**     | Weekday (aggregated) | Monday, Tuesday... (all Mondays combined)     |
| **Month of year**   | Month (aggregated)   | January, February... (all Januaries combined) |
| **Quarter of year** | Quarter (aggregated) | Q1, Q2, Q3, Q4 (all Q1s combined)             |

The "of week/year" options aggregate across all time. Use **Day of week** to see which weekday typically gets the most deals. Use **Month** to see trends month by month.

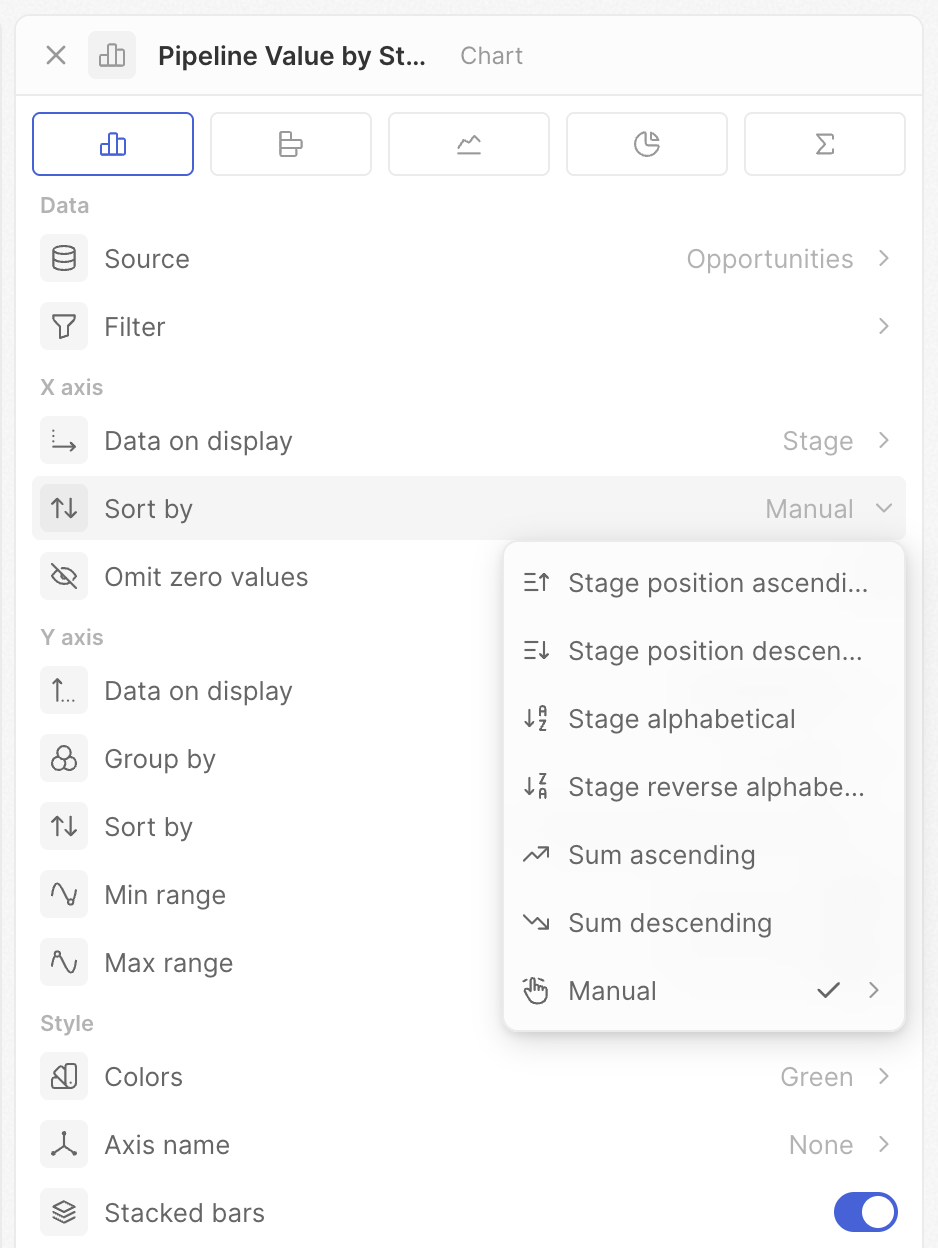
### <span style={{ display: 'inline-flex', alignItems: 'center', gap: '8px' }}> <ChartIcon icon="arrows-sort" />Sort by </span>

Control the order of categories on the X axis.

* **Position** – Uses the order defined in your Select field settings
* **Alphabetical** – A to Z (or chronological for dates)
* **By value** – Ordered by the metric (highest or lowest first)
* **Manual** – Drag to set your own order

<img src="https://mintcdn.com/twenty/rtjyQTAh0DrLn5Sz/images/user-guide/dashboard/dashboard-chart-settings-x-sort.png?fit=max&auto=format&n=rtjyQTAh0DrLn5Sz&q=85&s=a899892608d18d0e617723786d9fa646" alt="Sort by" width="938" height="1248" data-path="images/user-guide/dashboard/dashboard-chart-settings-x-sort.png" />

**Tip**: For pipeline stages, use **Position** to show stages in your sales process order (Lead → Qualified → Proposal → Won).

<Note>
  The options shown depend on your field type. Select fields have all options; date and text fields show fewer.
</Note>

<Tip>
  With **Manual** sorting, drag categories to create a custom order—perfect for highlighting specific segments or telling a story with your data.
</Tip>

### <span style={{ display: 'inline-flex', alignItems: 'center', gap: '8px' }}> <ChartIcon icon="eye-off" />Omit zero values </span>

Hide categories that have zero or no data.

* **On**: Categories with no records are hidden
* **Off**: All categories are shown, even if empty

Use this to clean up charts with sparse data.

***

## Y Axis Settings

These settings control what you're measuring and how it's displayed.

### <span style={{ display: 'inline-flex', alignItems: 'center', gap: '8px' }}> <ChartIcon icon="axis-y" />Data on display </span>

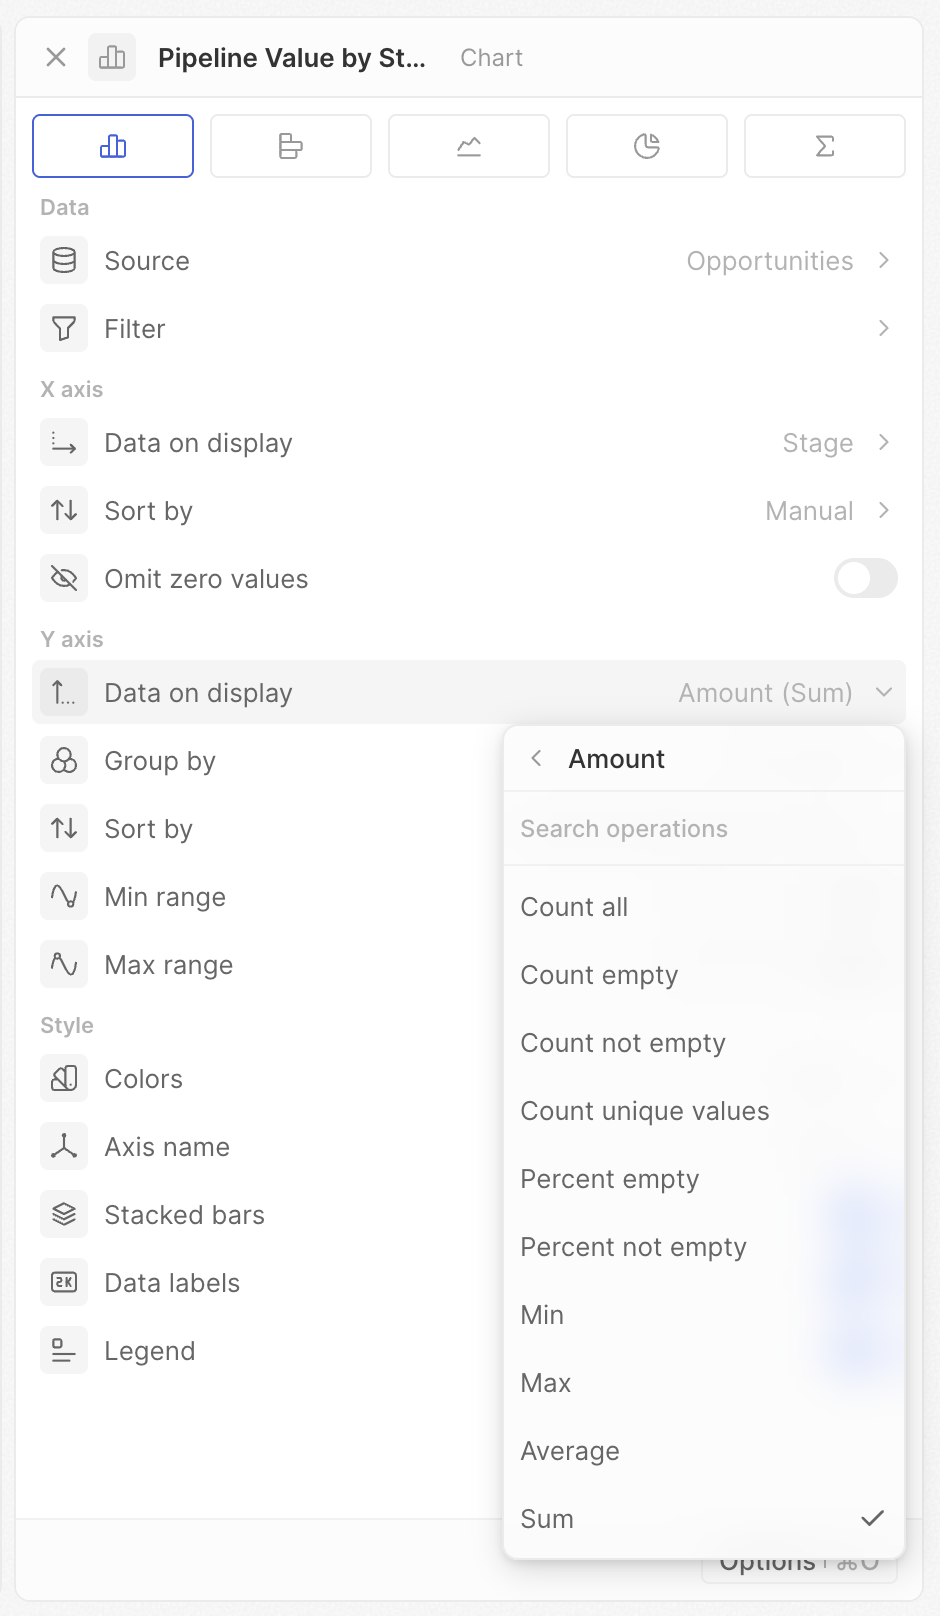
Select the field and operation to calculate your metric.

* **Counts** – Count all, Count empty, Count not empty, Count unique values
* **Math** – Sum, Average, Min, Max (number fields)
* **Percentages** – Percent empty, Percent not empty

Boolean fields add Count true/false. Aggregate charts with date fields show Earliest/Latest.

**Example**: Select "Amount" with Sum to see total deal value per category, or Count all to see number of deals.

<img src="https://mintcdn.com/twenty/rtjyQTAh0DrLn5Sz/images/user-guide/dashboard/dashboard-chart-settings-y-data-on-display.png?fit=max&auto=format&n=rtjyQTAh0DrLn5Sz&q=85&s=3ec4d55b8d52a6e62dce4246daf44386" alt="Data on display" width="940" height="1616" data-path="images/user-guide/dashboard/dashboard-chart-settings-y-data-on-display.png" />

<Note>
  The options shown depend on your field and chart type. If you don't see an expected operation, check your field type.
</Note>

### Ratio

For Select, Multi-select, or Boolean fields, you can calculate the percentage of a specific value.

1. Select a Select, Multi-select, or Boolean field
2. Enable **Ratio**
3. Choose the option to measure

**Example**: Show "Won" deals as a percentage of all opportunities. If you have 10 Won out of 50 total, the chart shows 20%.

### <span style={{ display: 'inline-flex', alignItems: 'center', gap: '8px' }}> <ChartIcon icon="filters" />Group by </span>

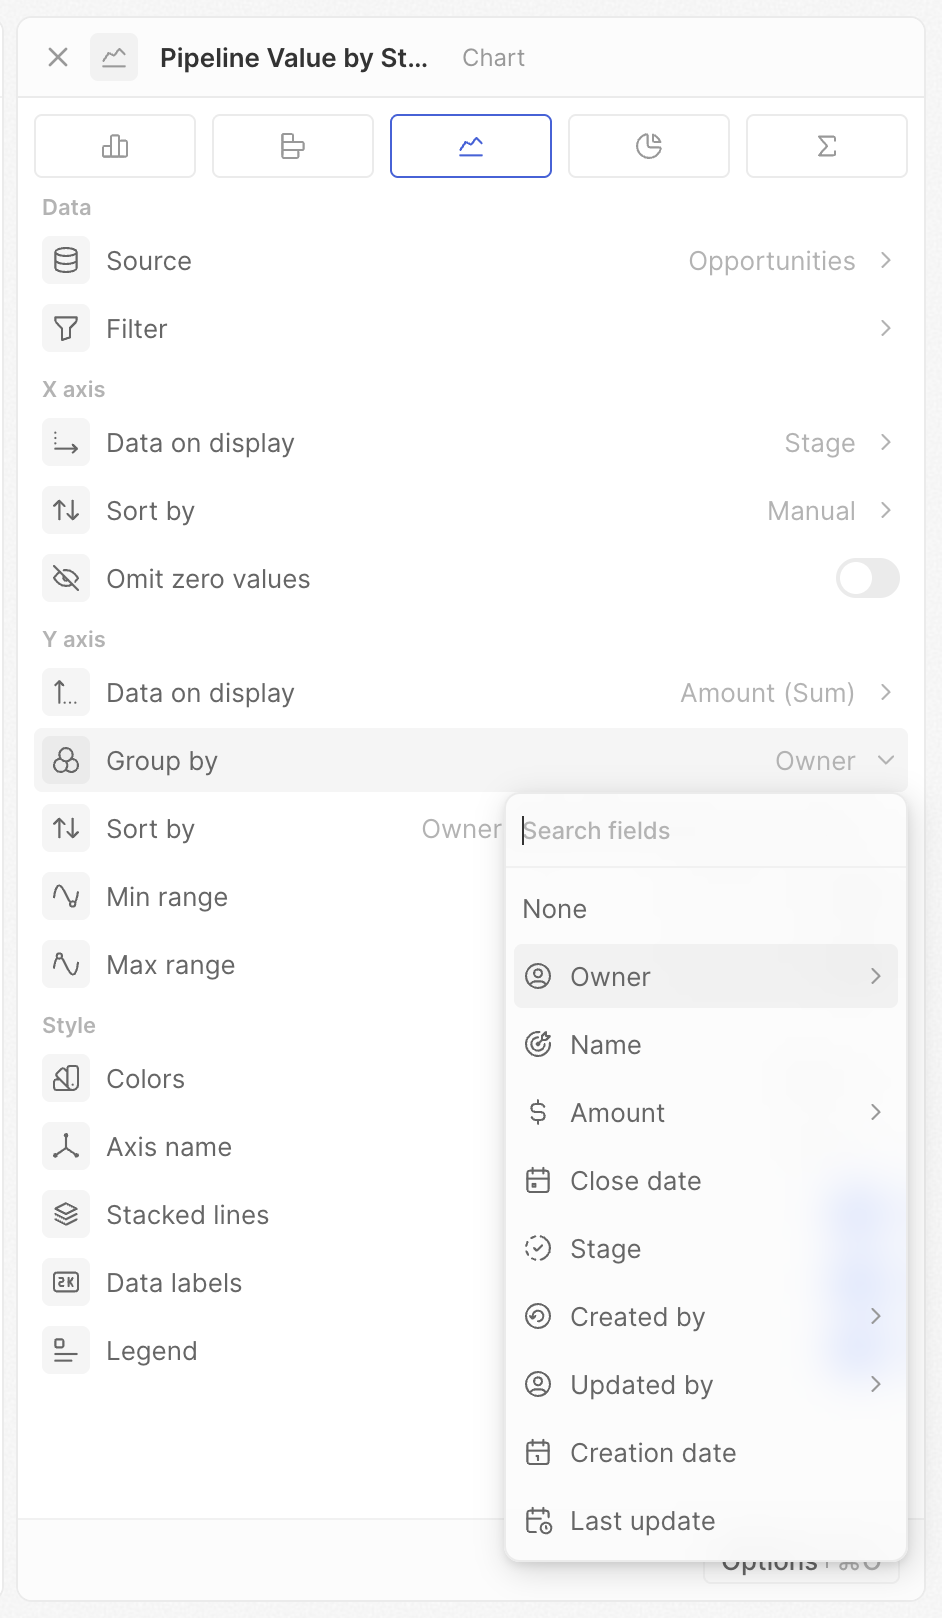
Add a second dimension to create multiple series (multiple bars or lines).

1. Set your X axis field first
2. Click **Group by**
3. Select a second field

**Example**: Group deals by Stage (X axis) AND by Owner (Group by) to see each person's pipeline breakdown side by side.

<img src="https://mintcdn.com/twenty/rtjyQTAh0DrLn5Sz/images/user-guide/dashboard/dashboard-chart-settings-y-group-by.png?fit=max&auto=format&n=rtjyQTAh0DrLn5Sz&q=85&s=fc136966d521c9d97d71aef816a0e46e" alt="Group by" width="942" height="1618" data-path="images/user-guide/dashboard/dashboard-chart-settings-y-group-by.png" />

When Group by is set, you'll see multiple colors in your chart and a legend appears.

### <span style={{ display: 'inline-flex', alignItems: 'center', gap: '8px' }}> <ChartIcon icon="calendar" />Date granularity </span>

When Group by is a date field, choose the time period (same options as X axis).

### <span style={{ display: 'inline-flex', alignItems: 'center', gap: '8px' }}> <ChartIcon icon="arrows-sort" />Sort by </span>

When **Group by** is set, control the order of grouped series (e.g., which owner's bar appears first within each category).

Same options as X axis sorting—Position, Alphabetical, and Manual—except **value-based sorting is not available** for secondary grouping.

### <span style={{ display: 'inline-flex', alignItems: 'center', gap: '8px' }}> <ChartIcon icon="chart-bar-popular" />Cumulative </span>

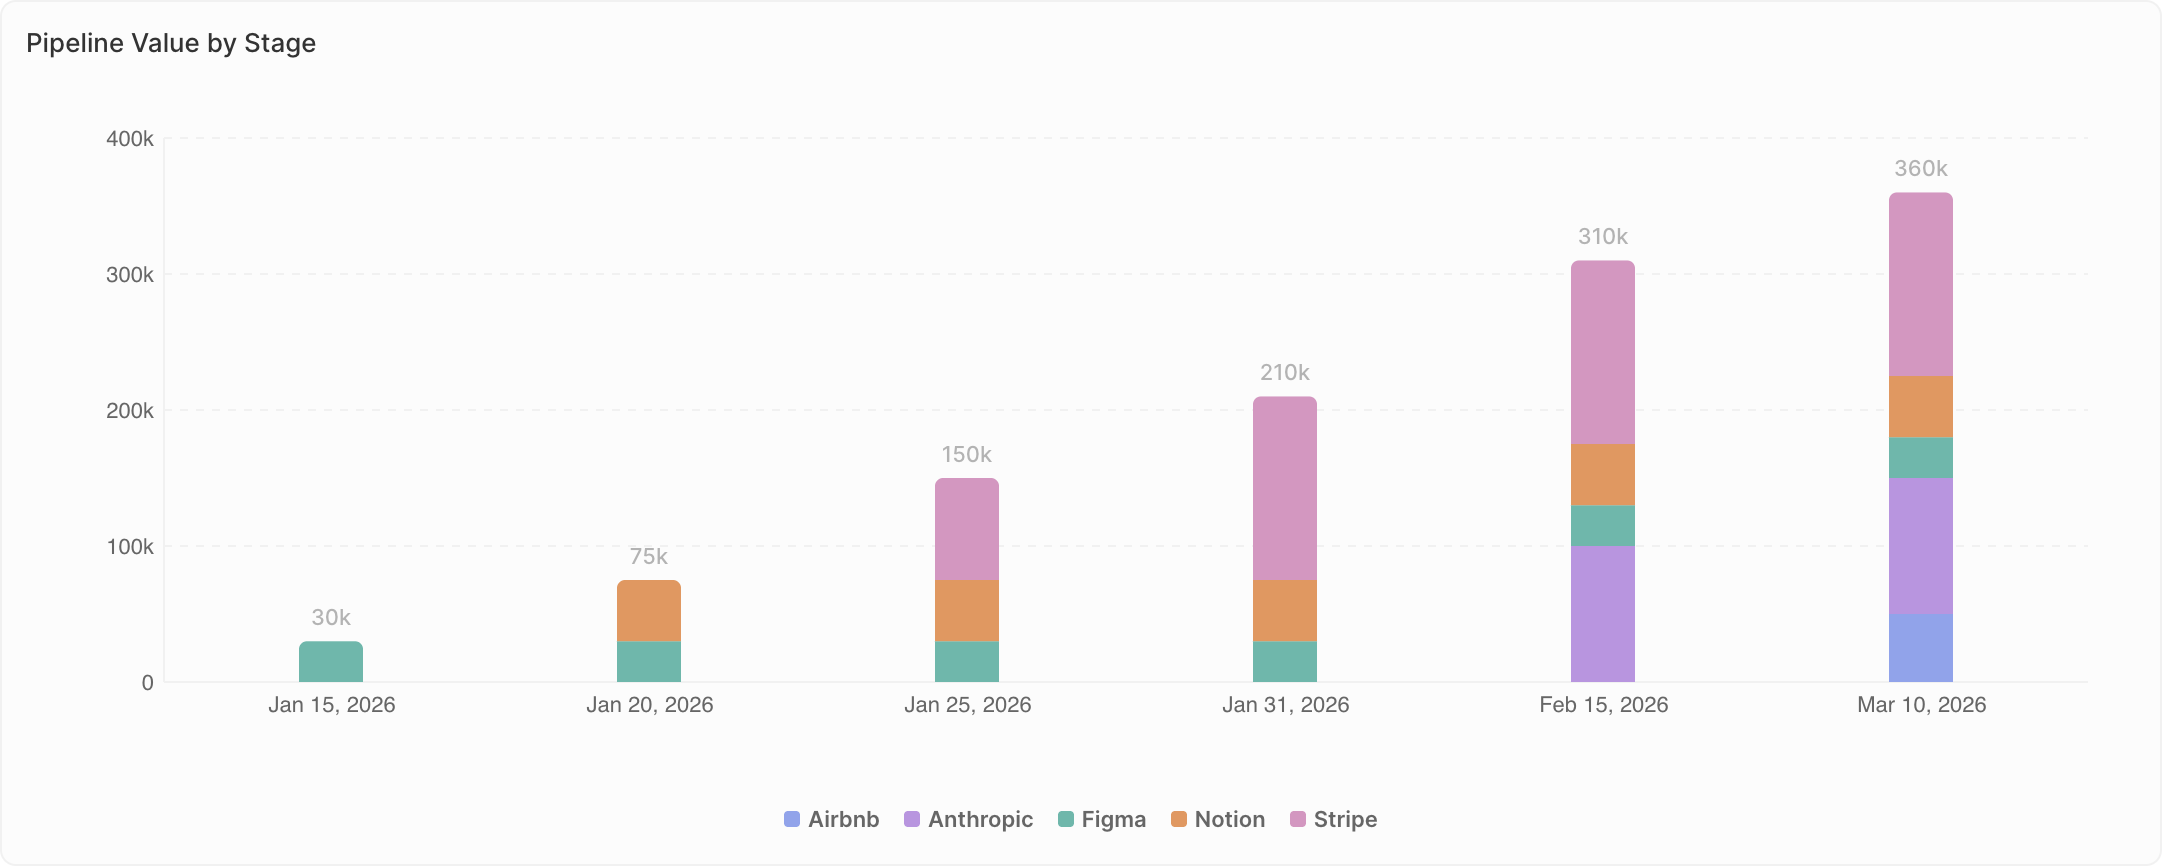
Show running totals instead of individual values.

* **Off**: Each bar/point shows its own value
* **On**: Each bar/point shows the sum of all previous values plus its own

**Example**: January = 10, February = 15

* Cumulative off: Shows 10 and 15
* Cumulative on: Shows 10 and 25 (10 + 15)

Use cumulative to track progress toward a goal over time.

<img src="https://mintcdn.com/twenty/rtjyQTAh0DrLn5Sz/images/user-guide/dashboard/dashboard-chart-settings-y-cumulative.png?fit=max&auto=format&n=rtjyQTAh0DrLn5Sz&q=85&s=c42268a10b32a38ccba1da90074a48ed" alt="Cumulative" width="2164" height="868" data-path="images/user-guide/dashboard/dashboard-chart-settings-y-cumulative.png" />

### <span style={{ display: 'inline-flex', alignItems: 'center', gap: '8px' }}> <ChartIcon icon="math-min" />Min range / <ChartIcon icon="math-max" />Max range </span>

Set fixed minimum and maximum values for the Y axis.

* Leave blank for automatic scaling
* Enter a number to fix the boundary

**When to use:**

* Set Min to 0 for accurate visual comparisons
* Set both for consistent scales across multiple charts
* Focus on a specific value range by setting both

***

## Style Settings

### <span style={{ display: 'inline-flex', alignItems: 'center', gap: '8px' }}> <ChartIcon icon="color-swatch" />Colors </span>

Set the color scheme for your chart. Choose from a variety of color palettes.

<Note>
  When grouping by a Select field, the chart automatically uses the colors defined for each option in your field settings.
</Note>

### <span style={{ display: 'inline-flex', alignItems: 'center', gap: '8px' }}> <ChartIcon icon="gizmo" />Axis name </span>

Choose which axis labels to show: **None**, **X axis**, **Y axis**, or **Both** (bar and line charts only).

### <span style={{ display: 'inline-flex', alignItems: 'center', gap: '8px' }}> <ChartIcon icon="stack-2" />Stacked bars / Stacked lines </span>

When Group by is set, choose how multiple series are displayed.

* **Off (Grouped)**: Series appear side by side. Use when comparing exact values between groups.
* **On (Stacked)**: Series stack on top of each other. Use when showing composition—how parts make up a whole.

**Example**: Deals by stage, grouped by owner

* Grouped: See each owner's exact numbers side by side
* Stacked: See total deals per stage, with each owner's contribution stacked

### <span style={{ display: 'inline-flex', alignItems: 'center', gap: '8px' }}> <ChartIcon icon="badge-2k" />Data labels </span>

Show values directly on chart elements (bars, points, slices).

* **On**: Values appear on the chart
* **Off**: No values shown (cleaner look)

### <span style={{ display: 'inline-flex', alignItems: 'center', gap: '8px' }}> <ChartIcon icon="text-caption" />Legend </span>

Show or hide the legend (only appears when Group by is set).

* **On**: Legend shows what each color represents
* **Off**: No legend displayed

<Tip>
  **Hover** over a legend item to highlight that group. **Click** to temporarily hide it from the chart.
</Tip>

***

## Chart-Specific Notes

### Pie charts

* <span style={{ display: 'inline-flex', verticalAlign: 'middle' }}><ChartIcon icon="chart-pie" size={16} /></span> **Each slice represents** – Define how slices are grouped
* <span style={{ display: 'inline-flex', verticalAlign: 'middle' }}><ChartIcon icon="eye-off" size={16} /></span> **Hide empty category** – Remove zero-value slices
* <span style={{ display: 'inline-flex', verticalAlign: 'middle' }}><ChartIcon icon="number-123" size={16} /></span> **Show value in center** – Display the aggregate value (sum, average, count, etc.)

### Aggregate charts

* <span style={{ display: 'inline-flex', verticalAlign: 'middle' }}><ChartIcon icon="caret-left" size={16} /></span> **Prefix** – Add text before the number (e.g., `$`)
* <span style={{ display: 'inline-flex', verticalAlign: 'middle' }}><ChartIcon icon="caret-right" size={16} /></span> **Suffix** – Add text after the number (e.g., `%`)