Overview
Dashboards in Twenty are organized in a hierarchy: Dashboards → Tabs → Widgets. Each dashboard can contain multiple tabs, and each tab contains widgets (charts, numbers, iFrames).Creating a Dashboard
- Go to Dashboards in the navigation
- Click + New Record
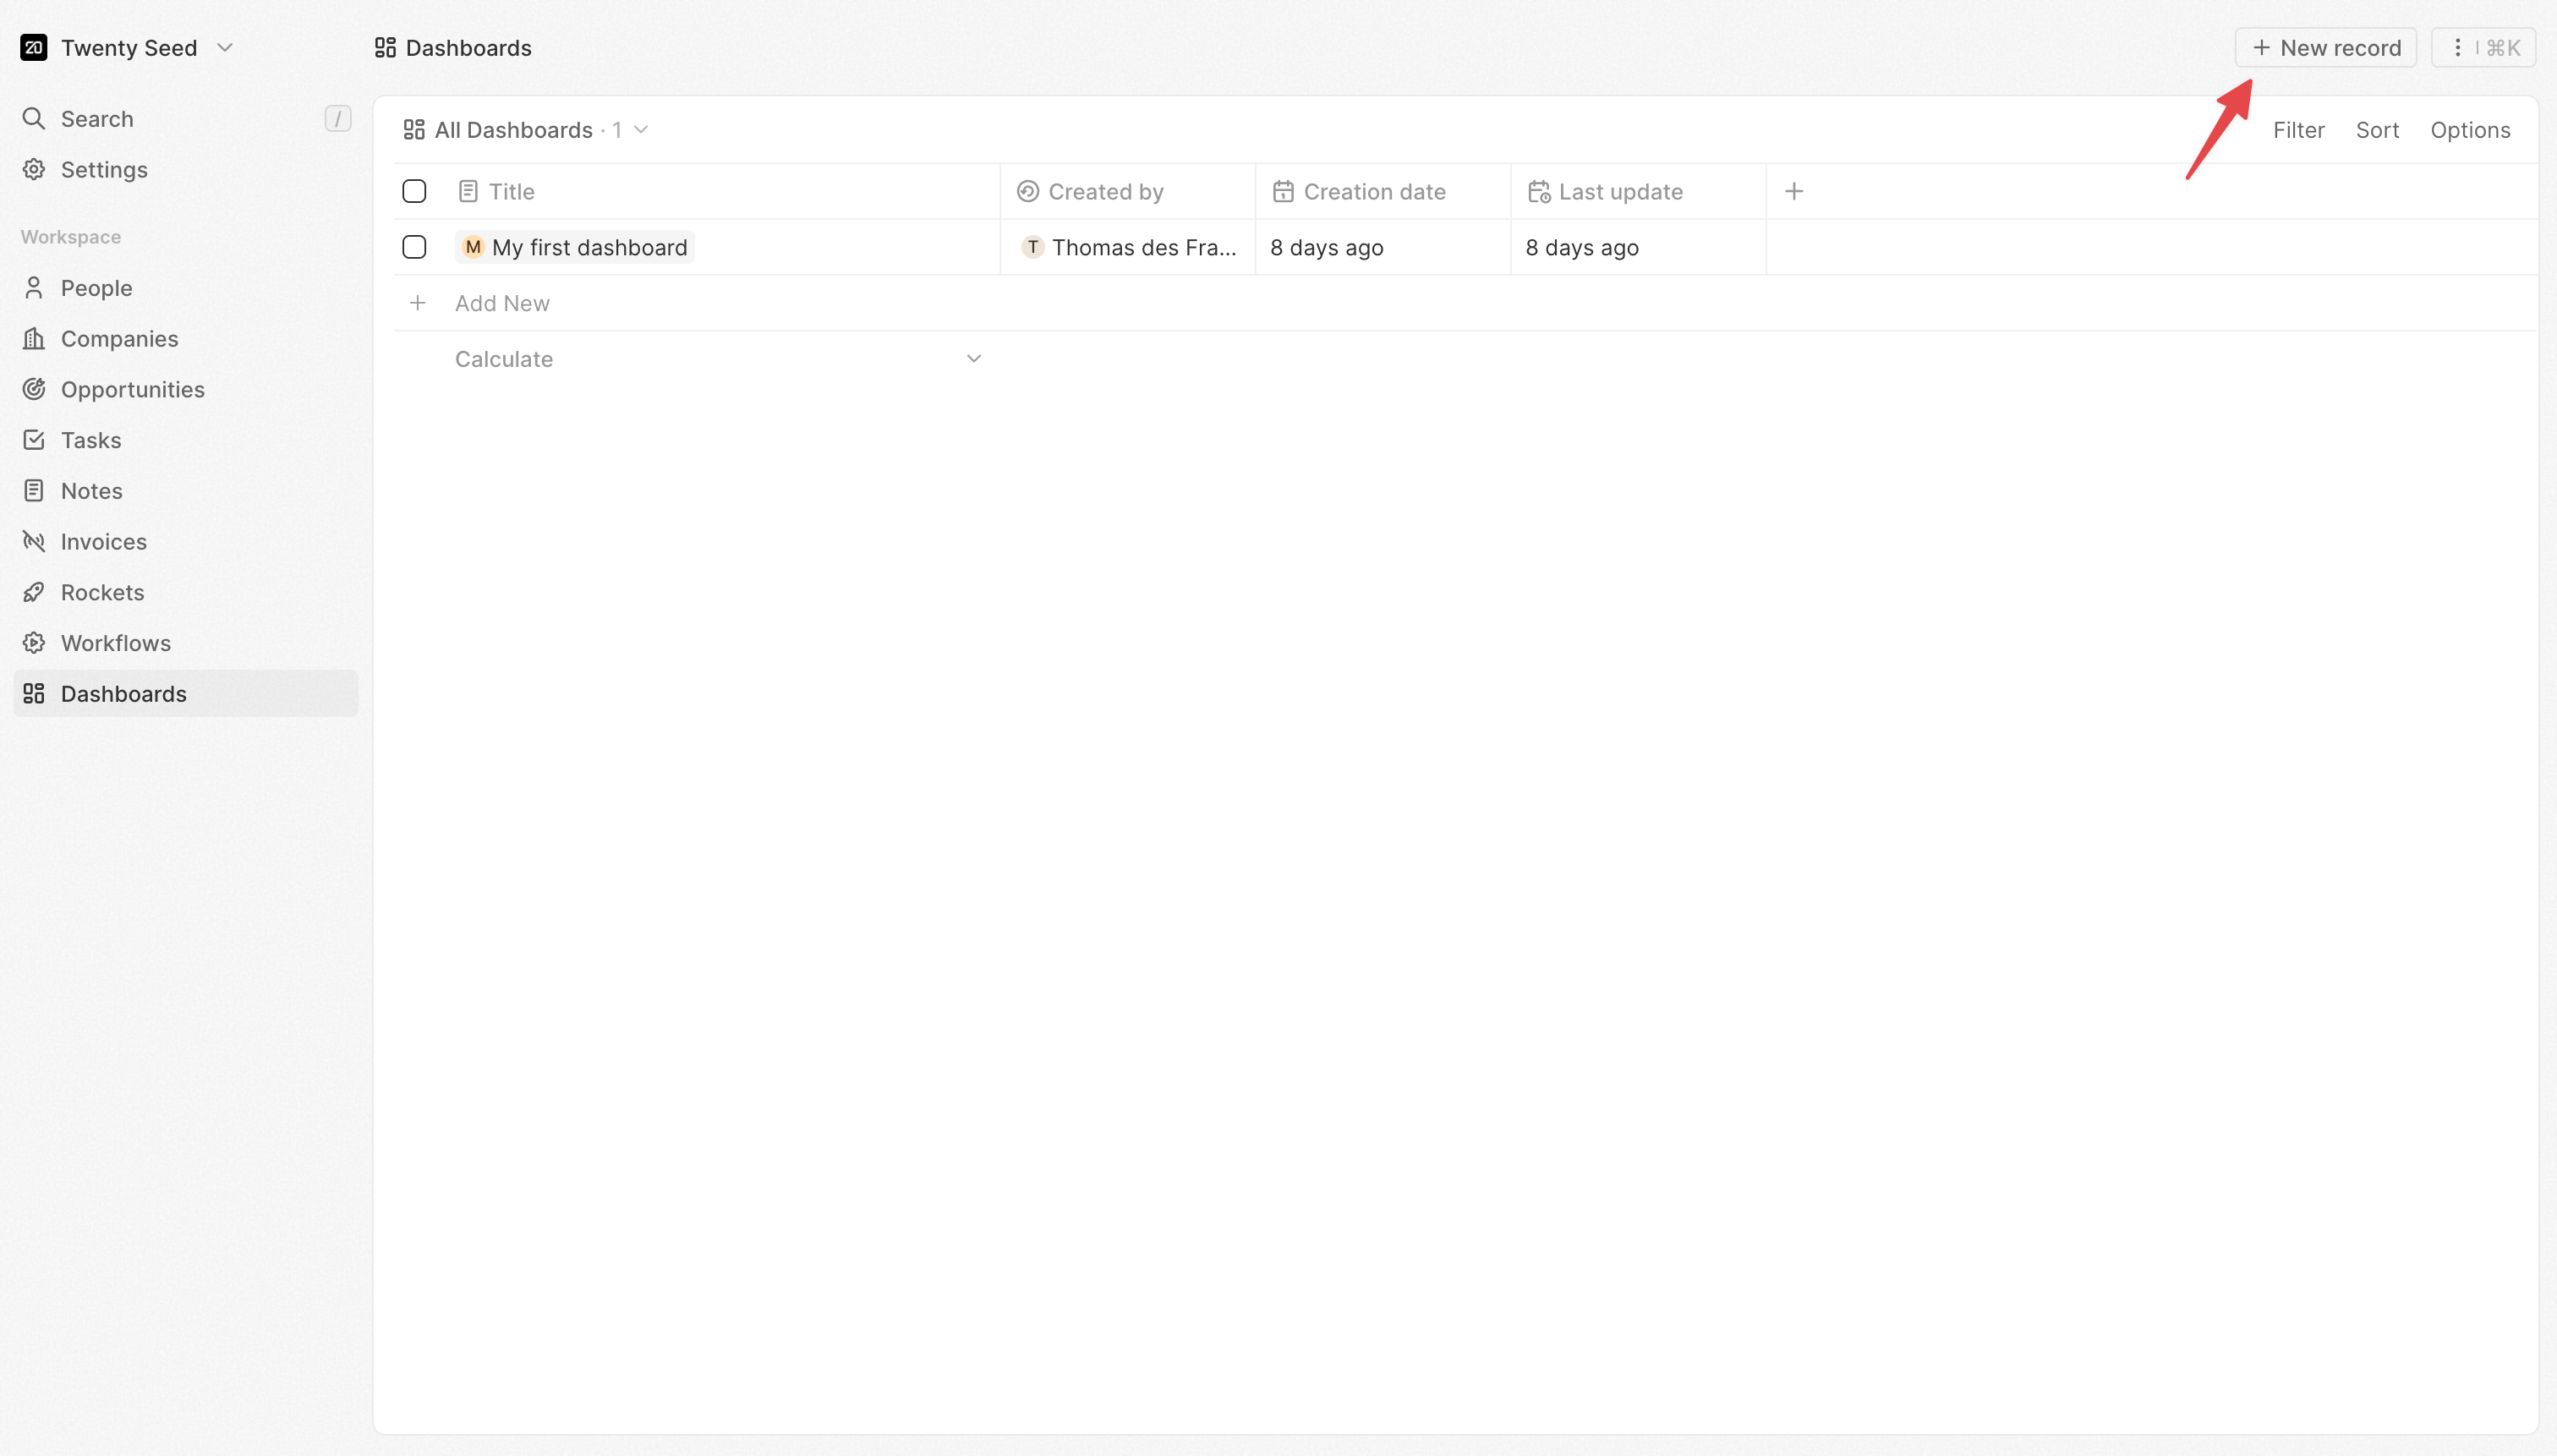
- Give your dashboard a name
- Start adding tabs and widgets
Working with Tabs
Tabs help you organize your dashboard into logical sections.Creating Tabs
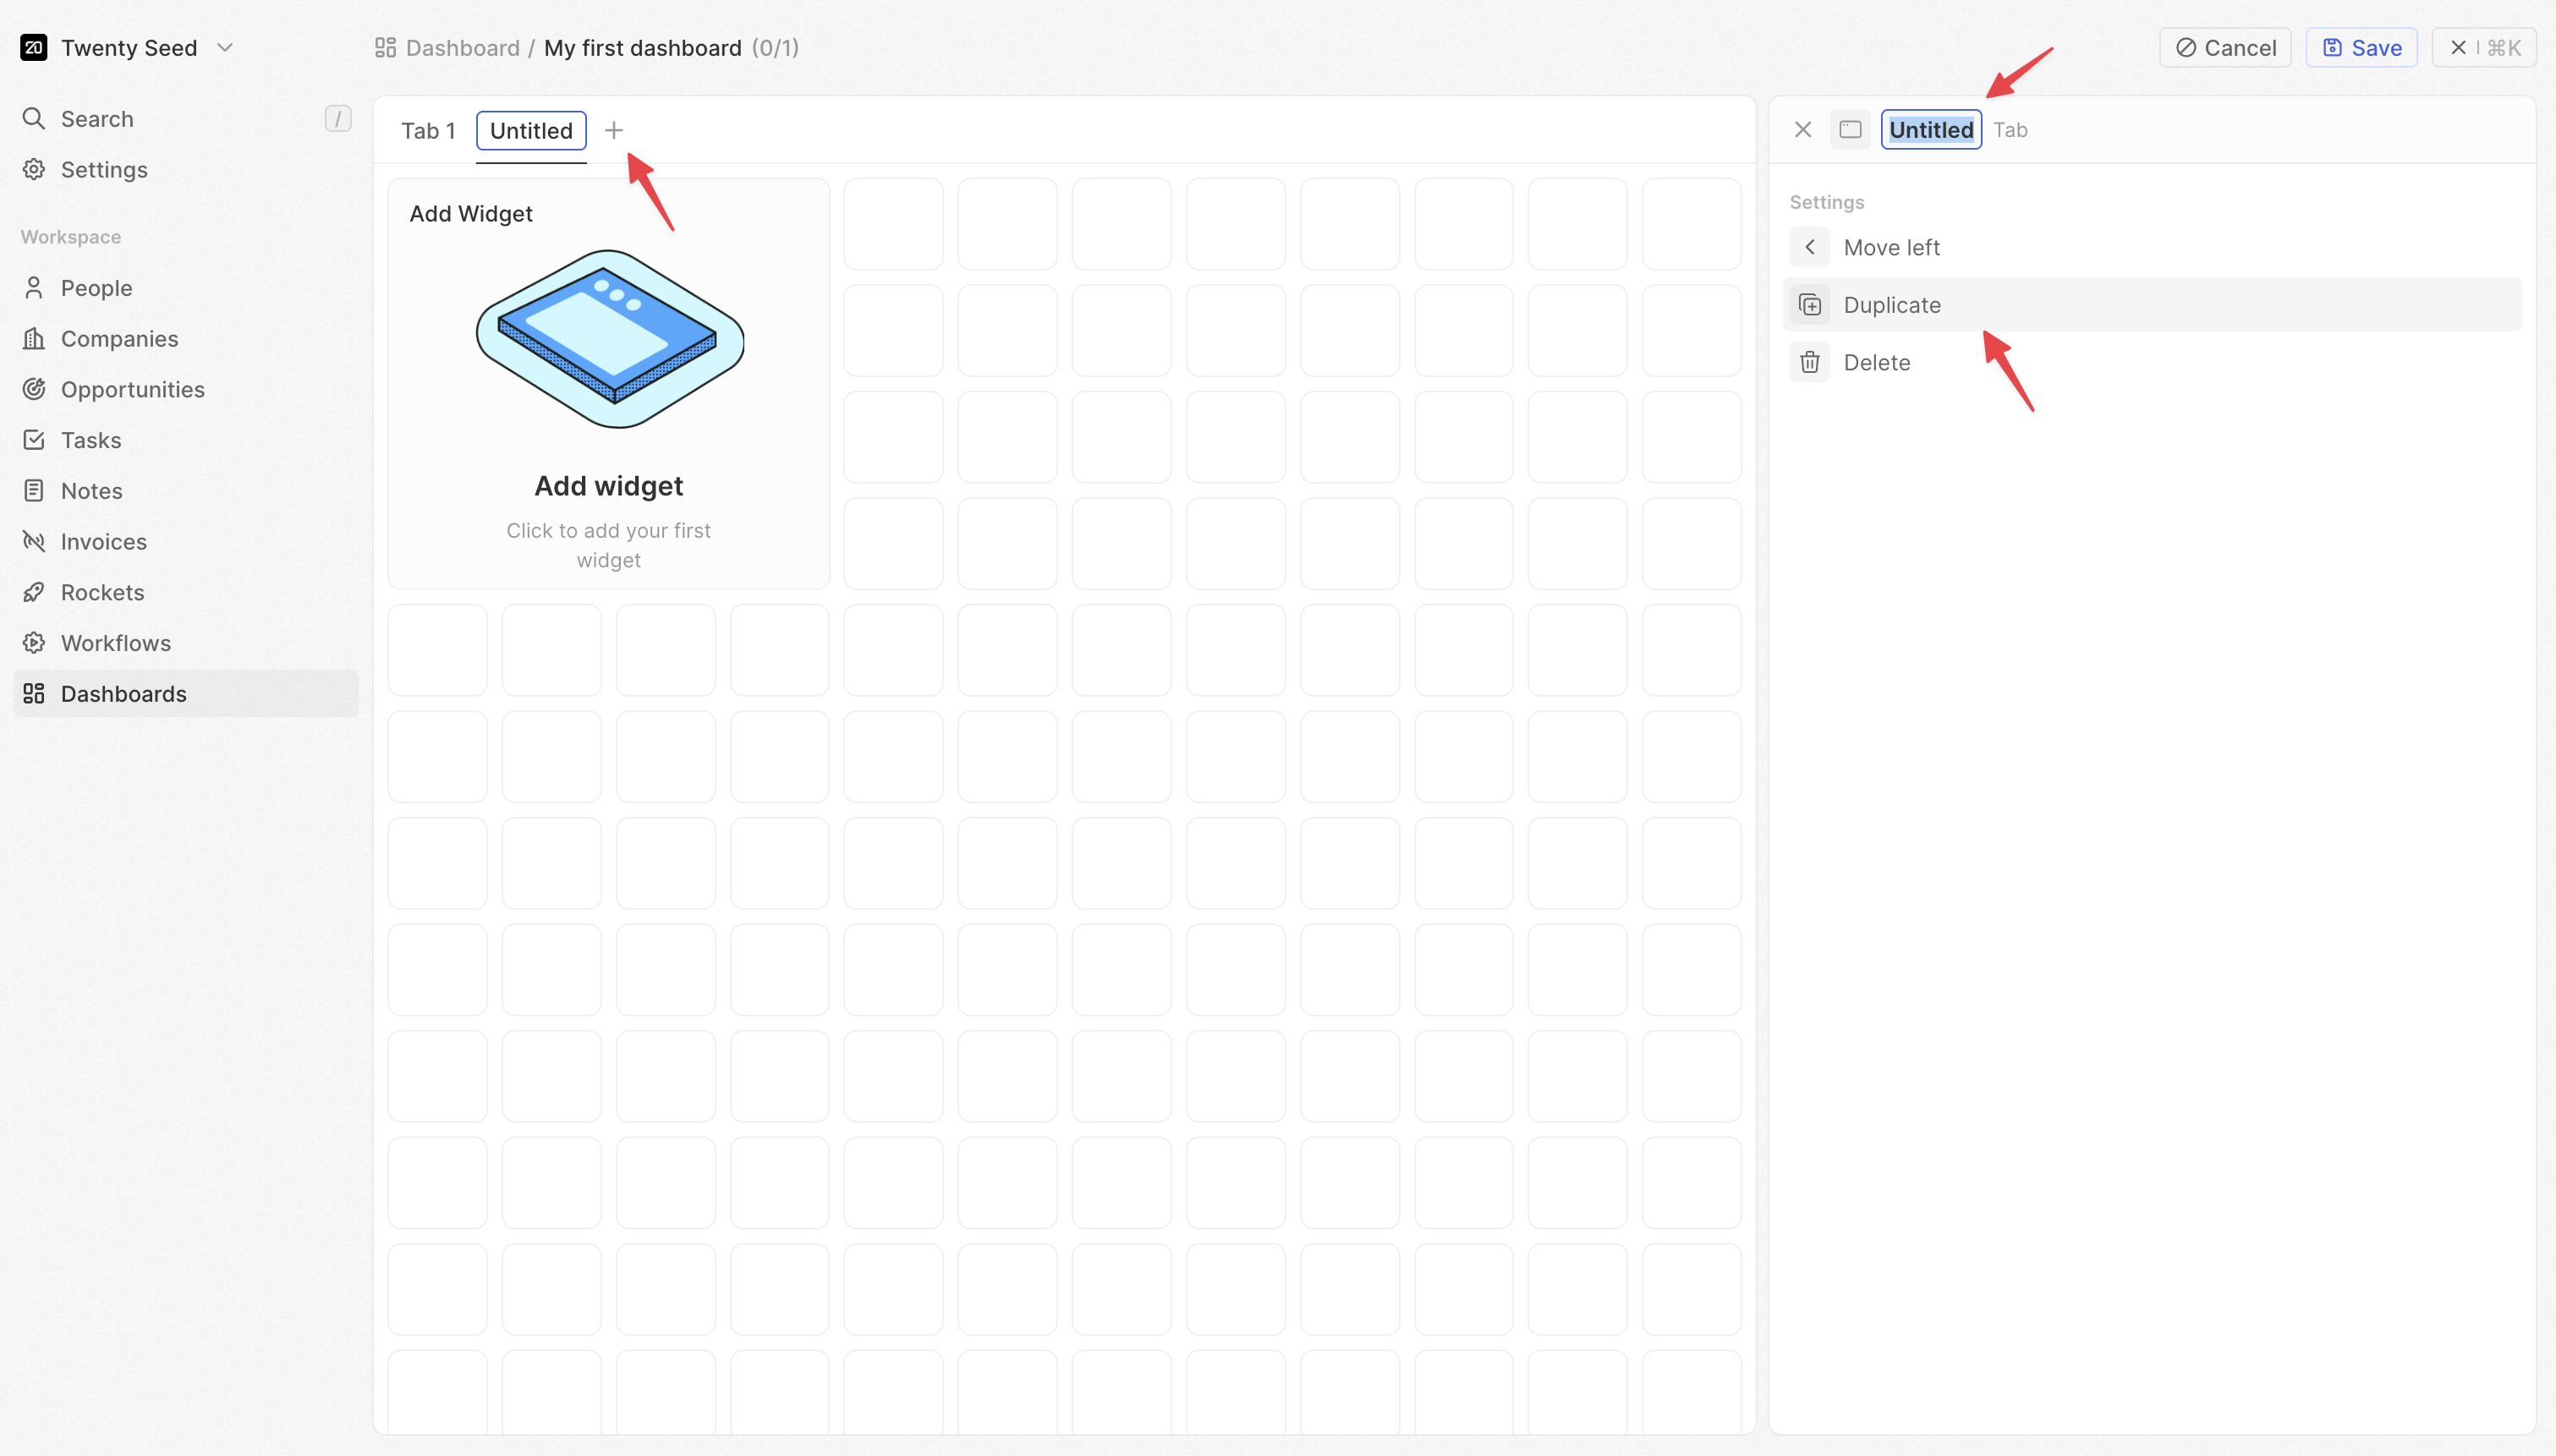
- In edit mode, click + in the tab bar, side panel will open on the right
- Name your tab (e.g., “Pipeline Overview”, “Team Performance”)
- Add widgets to the tab
Reordering Tabs
- In edit mode, click and hold on the tab you want to move
- Drag and drop to the new position
- You can also click on the tab and use the command menu to move the tab to left or right
Deleting Tabs
- In edit mode, click on the tab you want to delete
- Click the Delete button in the command menu
Duplicating Tabs
- Click on the tab you want to duplicate
- Click the Duplicate button in the side panel
Dashboard Layout
Arranging Widgets
- Drag and drop to position
- Resize for emphasis
- Group related charts together
Duplicating a Dashboard
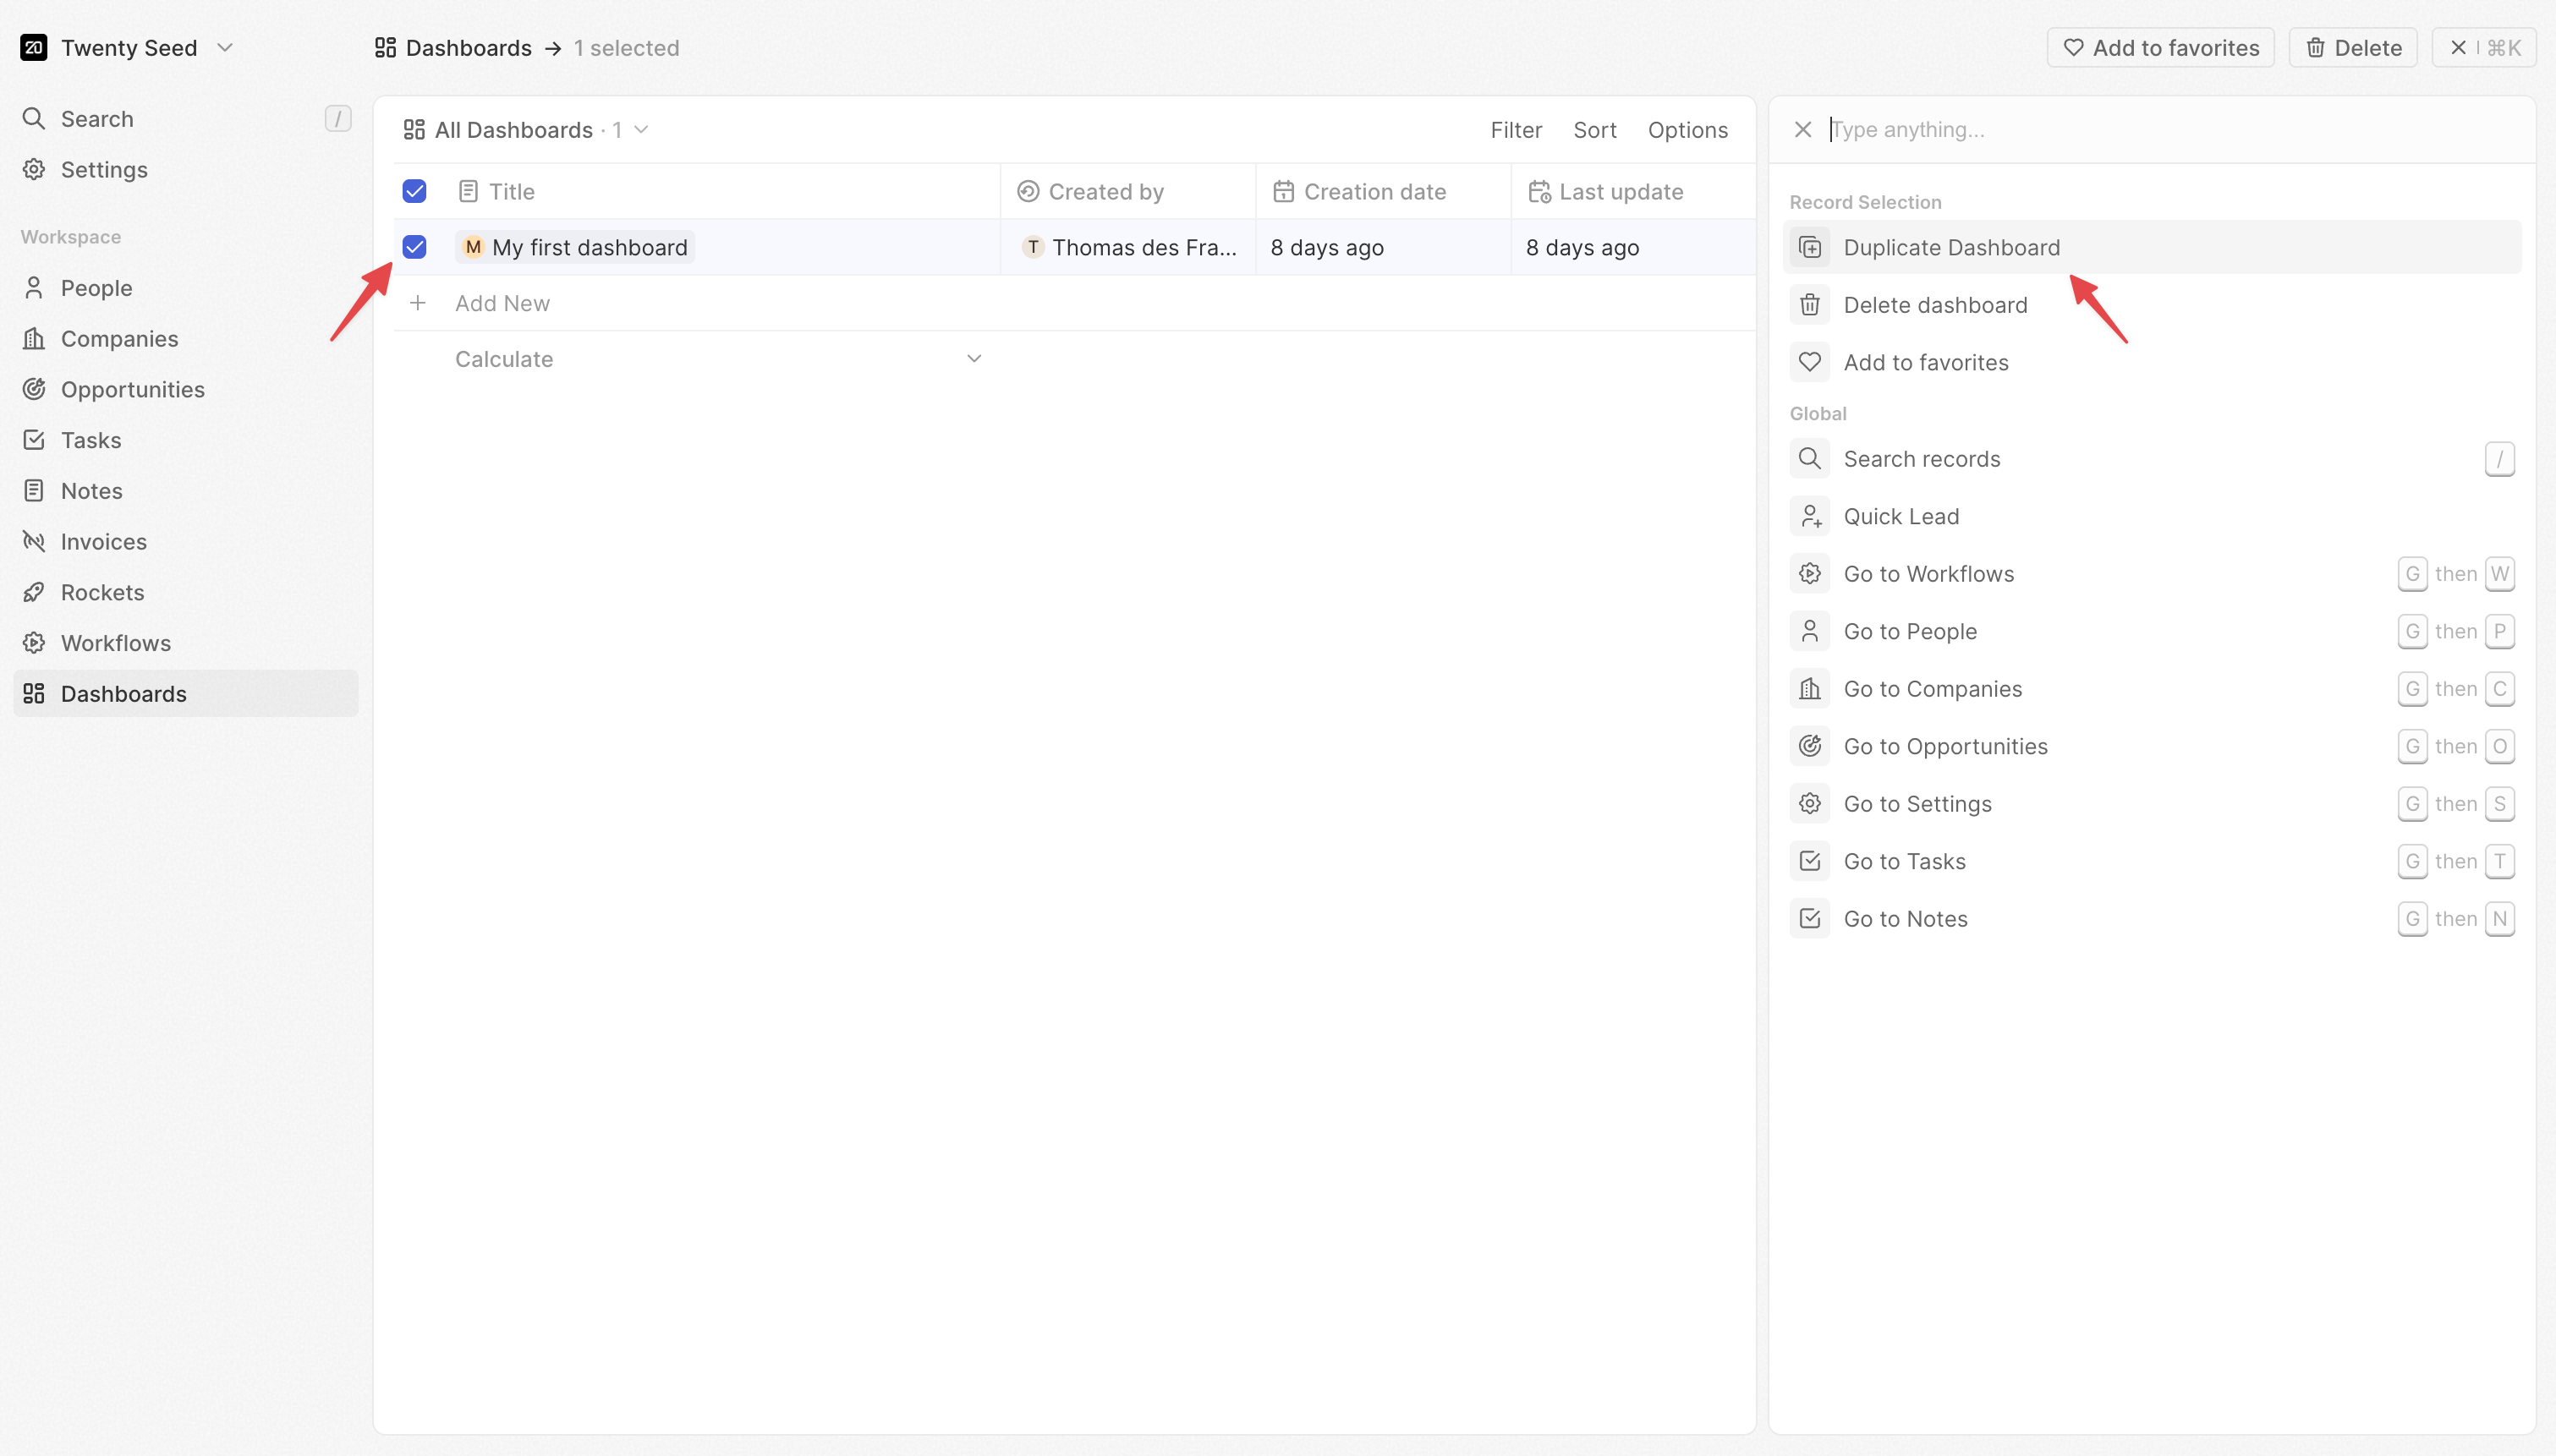
- Select the dashboard you want to duplicate
- Open the command bar with Cmd + K (or Ctrl + K on Windows)
- Select Duplicate dashboard
Best Practices
- Logical flow: Arrange from overview to detail
- Visual hierarchy: Larger charts for key metrics
- Consistent styling: Use matching colors and fonts
Visibility & Access
Dashboard Visibility
Dashboards are visible to everyone who has access to your Twenty workspace. There is no private dashboard option at the moment.Favorites
You can add dashboards to your favorites for quick access. This is a personal setting—your favorites are not visible to other users. To add a dashboard to favorites, open the dashboard and click the star icon.Timezone Behavior
Dashboards currently display data based on the timezone of the user viewing them. This means the same dashboard may show different metrics for team members in different regions (e.g., APAC vs. US).Coming soon: We will add the ability to set a specific timezone for a dashboard, so all users see consistent data regardless of their location.
Coming soon: Dashboard-level filters will allow you to apply filters across all widgets at once, making it faster to explore your data.