ダッシュボードは現在ベータ版です。 設定 → 更新 → 早期アクセスで有効にしてください。
ダッシュボードの理解
Twenty のダッシュボードは、主要なパフォーマンス指標を視覚的に追跡し、CRM データからインサイトを得るための手段を提供します。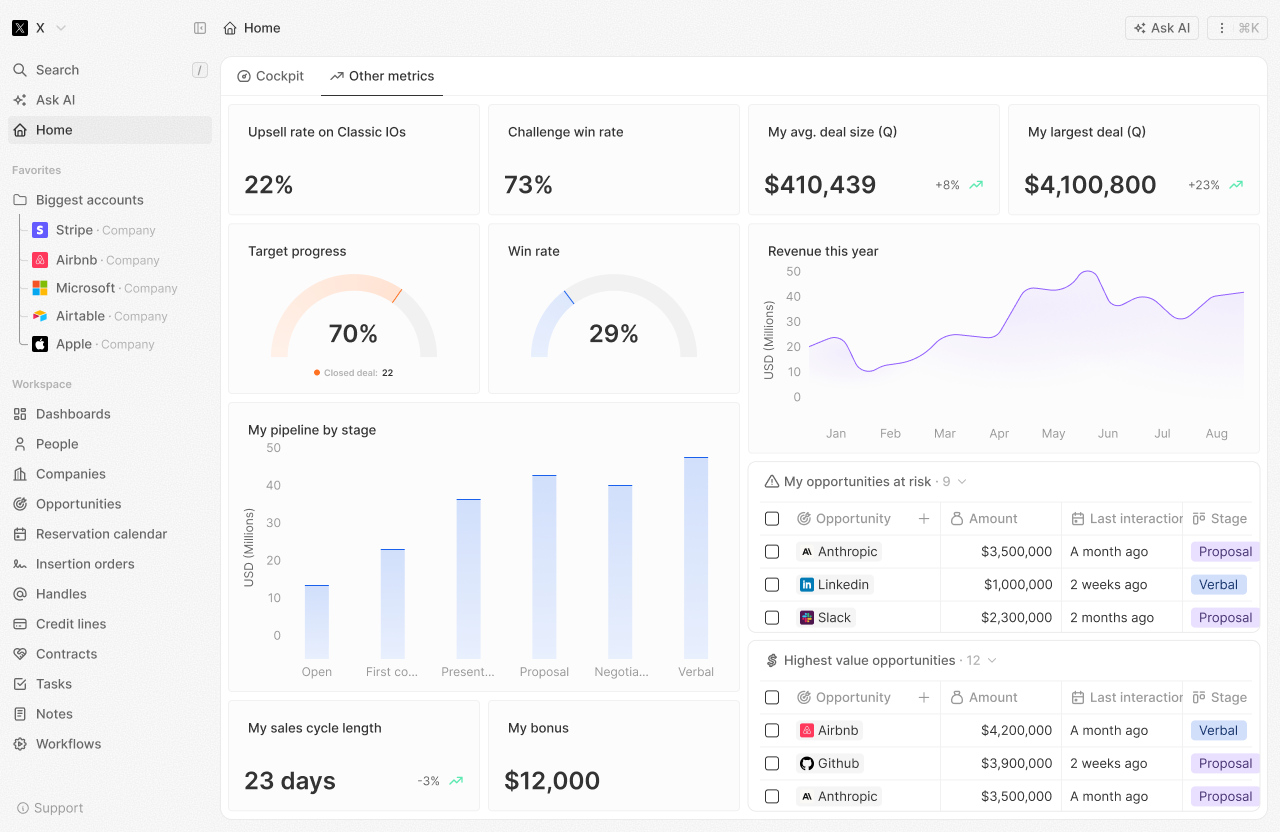
主要な概念
ダッシュボード
ダッシュボードは、CRM データをひと目で表示するタブの集合です。 目的に応じて複数のダッシュボードを作成できます:- 営業パフォーマンス
- チームの活動
- パイプラインの健全性
- カスタム指標
タブ
タブを使うと、ダッシュボードをセクションに整理できます。 各タブには1つ以上のウィジェットが含まれます。ウィジェット
ウィジェットは、特定のデータを表示する個別の可視化です。 種類には次のものがあります:- 棒グラフ
- パイチャート
- ラインチャート
- 集計チャート
- iFrame
- リッチテキスト
現在の制限:
- ダッシュボードのエクスポートおよび外部ユーザー(Twenty 以外のユーザー)との共有は、現時点では利用できません。
- ゲージチャートおよびテーブルはまだ利用できません。
始めに
最初のダッシュボードを作成する
- 「Dashboards」セクションに移動します
- 「+ New Dashboard」をクリックします
- ダッシュボードに名前を付けます
- コンテンツを整理するためにタブを追加します
- データを表示するためにウィジェットを追加します
- 保存
ウィジェットの追加
- ダッシュボードのタブを開きます
- 「+ Add Widget」をクリックします
- ウィジェットの種類を選択します
- データソース(オブジェクト)を選択します
- ウィジェットの設定を行います
- ウィジェットを保存して表示します
ベストプラクティス
- シンプルに始める: いくつかの主要な指標から始め、徐々に追加していきます
- 実行可能なデータに集中: 意思決定を促進する指標を表示します
- 定期的な確認: 傾向を見つけるためにダッシュボードを定期的に確認します
- チームで共有: 関連するチームメンバーがダッシュボードを閲覧できるようにします