Os painéis estão atualmente em versão beta. Ative-os em Configurações → Atualizações → Acesso antecipado.
Entendendo os painéis
Os painéis no Twenty oferecem uma forma visual de acompanhar suas principais métricas de desempenho e obter insights dos seus dados de CRM.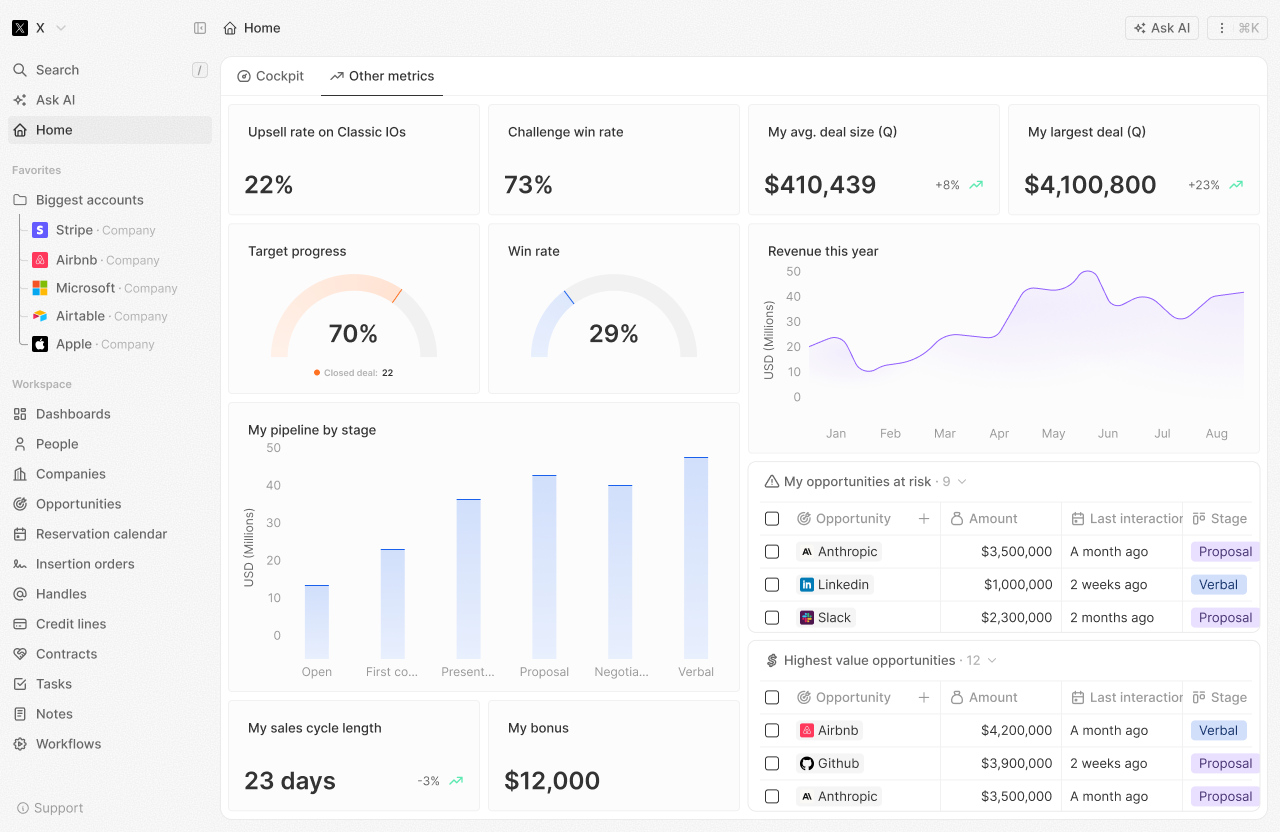
Conceitos principais
Painéis
Um painel é uma coleção de abas que exibem seus dados de CRM num relance. Você pode criar vários painéis para diferentes finalidades:- Desempenho de vendas
- Atividade da equipe
- Saúde do pipeline
- Métricas personalizadas
Abas
As abas permitem organizar seu painel em seções. Cada aba contém um ou mais widgets.Widgets
Widgets são visualizações individuais que exibem dados específicos. Os tipos incluem:- Gráficos de barras
- Gráficos de pizza
- Gráficos de linha
- Gráficos agregados
- iFrames
- Texto enriquecido
Limitações atuais:
- A exportação de painéis e o compartilhamento com usuários externos (usuários não-Twenty) não estão disponíveis no momento.
- Gráficos de indicador e tabelas ainda não estão disponíveis.
Primeiros passos
Criando seu primeiro painel
- Navegue até a seção Dashboards
- Clique em + New Dashboard
- Dê um nome ao seu painel
- Adicione abas para organizar seu conteúdo
- Adicione widgets para exibir seus dados
- Salvar
Adicionando widgets
- Abra uma aba no seu painel
- Clique em + Add Widget
- Selecione o tipo de widget
- Escolha a fonte de dados (objeto)
- Configure as configurações do widget
- Salve e visualize seu widget
Melhores Práticas
- Comece simples: Inicie com algumas métricas-chave e adicione mais ao longo do tempo
- Foque em dados acionáveis: Exiba métricas que orientem as decisões
- Revisão regular: Verifique seus painéis regularmente para identificar tendências
- Compartilhe com a equipe: Torne os painéis visíveis para os membros relevantes da equipe